Question
The chemicals in clay used to make pottery can differ depending on the geographical region where the clay originated. Sometimes, archaeologists use a chemical analysis of clay to help identify where a piece of pottery originated. Such an analysis measures the amount of a chemical in the clay as a percent of the total weight of the piece of pottery. The boxplots below summarize analyses done for three chemicals \(-\mathrm{X}, \mathrm{Y}\), and \(\mathrm{Z} \longrightarrow\) on pieces of pottery that originated at one of three sites: I, II, or III.

(a) For chemical Z, describe how the percents found in the pieces of pottery are similar and how they differ among the three sites.
(b) Consider a piece of pottery known to have originated at one of the three sites, but the actual site is not known.
(i) Suppose an analysis of the clay reveals that the sum of the percents of the three chemicals \(\mathrm{X}\), \(\mathrm{Y}\), and \(\mathrm{Z}\) is \(20.5 \%\). Based on the boxplots, which site-I, II, or III-is the most likely site where the piece of pottery originated? Justify your choice.
(ii) Suppose only one chemical could be analyzed in the piece of pottery. Which chemical-X, Y, or Zwould be the most useful in identifying the site where the piece of pottery originated? Justify your choice.
▶️Answer/Explanation
Ans:
(a)The median percent of chemical \(z\) in pottery is very similar across all three sites, at around 7\%. However, the range of \(z\) differs between the sites. Site II has a smaller IQR for \(Z\) than site I or site III, whose IQRs are similar. Site II ass has the smallest range for chemical \(Z\), followed by site I and site II, which hos the largest range. These observations are from the graph of boxplots.
b(i) Using the median chemical percentages, Site III is the most likely site of this piece of pottery. The sum of the median values in Site III for Chemicals \(x, y\), and \(z\), respectively, are around 6,7, and 7, which sum to \(20 \%\). This is the closest to the value of \(20.5 \%\) using the medians, as site I would give \(7.5+13+7=27.5 \%\) and site II would give around \(6+3+7=16 \%\) for the percentage sums. These values were obtained from the graph of baxplots.
(ii)Chemical \(y\) would be the most useful in site identification if only one chemical could be analyzed. The graph of boxplots show that only chemical \(Y\) has significantly different possible percentages across the three sites. \(y\) is present in \(11-15 \%\) in site I, \(24 \%\) in site II, and \(6-8 \%\) in Site III, allowing for easy identification. Chemicals \(x\) and \(z\) have overlaps in their ranges across the sites, noting out definite identification based an those chemicals.
Question
The table and the bar chart below summarize the age at diagnosis, in years, for a random sample of 207 men and women currently being treated for schizophrenia.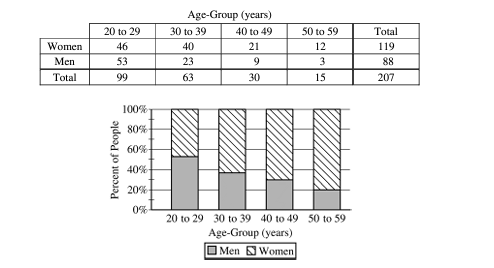
Do the data provide convincing statistical evidence of an association between age-group and gender in the diagnosis of schizophrenia?
▶️Answer/Explanation
Ans:
\(x^2\) test homogeniety
independent :one person’s schizophrenia has no affect on another schizophrenia
Random: There is a “random sample of 207 men and women.”
Expected cell Freq: The lowest expected cell frequency is 64 . \(64>5\)
\(H_0\) : there is no association between age-group/gender in dlagnosis of schizophren
\(H_A\) : there is an association between age-group/gender in diagnosis of schizophres
\(\sum \frac{(O b s-\text { Exp })^2}{\text { expected }}\)
\(\begin{aligned} & x^2=10.88 \\ & d f=3 \\ & p=.0123\end{aligned}\)
\(\sum \frac{(46-56.913)^2}{56.913}+\ldots\)
Based on this sample, with an \(\alpha\) level of . OS, and a p-vame of .0123 , 1 fail to reject the \(H_0\), meaning I dort have evidence that there is an association between age-group/gender in the diagnosis, of schizophrenia.
Question
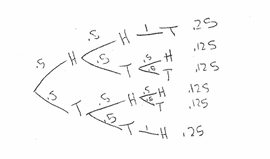
Consider an experiment in which two men and two women will be randomly assigned to either a treatment group or a control group in such a way that each group has two people. The people are identified as Man 1, Man 2, Woman 1, and Woman 2. The six possible arrangements are shown below.
Two possible methods of assignment are being considered: the sequential coin flip method, as described in part (a), and the chip method, as described in part (b). For each method, the order of the assignment will be Man 1, Man 2, Woman 1, Woman 2.
(a) For the sequential coin flip method, a fair coin is flipped until one group has two people. An outcome of tails assigns the person to the treatment group, and an outcome of heads assigns the person to the control group. As soon as one group has two people, the remaining people are automatically assigned to the other group.
(i) Complete the table below by calculating the probability of each arrangement occurring if the sequential coin flip method is used.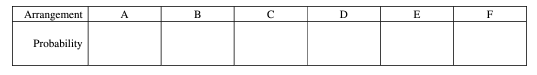
(ii) For the sequential coin flip method, what is the probability that Man 1 and Man 2 are assigned to the same group?
The six arrangements are repeated below.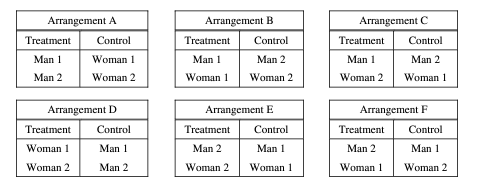
(b) For the chip method, two chips are marked “treatment” and two chips are marked “control.” Each person selects one chip at random without replacement.
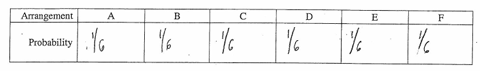
(i) Complete the table below by calculating the probability of each arrangement occurring if the chip method is used.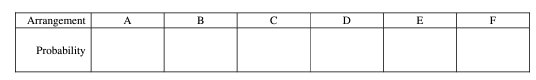
(ii) For the chip method, what is the probability that Man 1 and Man 2 are assigned to the same group?
(c) Sixteen participants consisting of 10 students and 6 teachers at an elementary school will be used for an experiment to determine lunch preference for the school population of students and teachers. As the participants enter the school cafeteria for lunch, they will be randomly assigned to receive one of two lunches so that 8 will receive a salad, and 8 will receive a grilled cheese sandwich. The students will enter the cafeteria first, and the teachers will enter next. Which method, the sequential coin flip method or the chip method, should be used to assign the treatments? Justify your choice.
▶️Answer/Explanation
Ans:
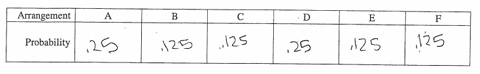
The provability that Statical and \(\|_{a, 2} 2\) are assigned to the sone group is .5 .
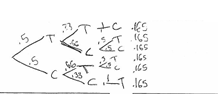
(ii)The probability that man 1 and \(\operatorname{man} 2\) are assigned to the same group is \(7 / 6\) of 3333 .
(c)I would use the chip withers because the probability of each arrangement is the same. If I we the cointlip method, a such person’s independent on the people who went before them. And after ane treatment is filled up, the probability of any ore getting that treatment after that is \(O\).