Question
The manager of a grocery store selected a random sample of 11 customers to investigate the relationship between the number of customers in a checkout line and the time to finish checkout. As soon as the selected customer entered the end of a checkout line, data were collected on the number of customers in line who were in front of the selected customer and the time, in seconds, until the selected customer was finished with the checkout. The data are shown in the following scatterplot along with the corresponding least-squares regression line and computer output.

(a) Identify and interpret in context the estimate of the intercept for the least-squares regression line.
(b) Identify and interpret in context the coefficient of determination, \(r^2\).
(c) One of the data points was determined to be an outlier. Circle the point on the scatterplot and explain why the point is considered an outlier.
▶️Answer/Explanation
Ans:
(a)The estimate of the intercept, which is 72.95 seconds, means that if there are no customers in the line, the predicted time to first checkout is 72.95 secmacs.
(b) The \(c^2\) value of \(73.33 \%\) means that about \(73.33 \%\) of the variation of time to finish checkout, \(y\), can be explained of the least-squares regression line of containers in line, \(x\), and time to fish checkout,\(y\).
This points is considered on outlier because its whee is very far from the predicted value of the least squares regression line. The point’s while is about 100 while, when there are 3 costumers in line, the LSRL predicts a value of about 600 .
Question
An environmental science teacher at a high school with a large population of students wanted to estimate the proportion of students at the school who regularly recycle plastic bottles. The teacher selected a random sample of students at the school to survey. Each selected student went into the teacher’s office, one at a time, and was asked to respond yes or no to the following question.
Do you regularly recycle plastic bottles?
Based on the responses, a 95 percent confidence interval for the proportion of all students at the school who would respond yes to the question was calculated as \((0.584,0.816)\).
(a) How many students were in the sample selected by the environmental science teacher?
(b) Given the method used by the environmental science teacher to collect the responses, explain how bias might have been introduced and describe how the bias might affect the point estimate of the proportion of all students at the school who would respond yes to the question.
(c) The statistics teacher at the high school was concerned about the potential bias in the survey. To obtain a potentially less biased estimate of the proportion, the statistics teacher used an alternate method for collecting student responses. A random sample of 300 students was selected, and each student was given the following instructions on how to respond to the question.
– In private, flip a fair coin.
– If heads, you must respond no, regardless of whether you regularly recycle.
– If tails, please truthfully respond yes or no.
(i) What is the expected number of students from the sample of 300 who would be required to respond no because the coin flip resulted in heads?
(ii) The results of the sample showed that 213 of the 300 selected students responded no. Based on the results of the sample, give a point estimate for the proportion of all students at the high school who would respond yes to the question.
▶️Answer/Explanation
Ans:
(a)\(\begin{aligned} & \text { point estimate }=(0.816+0.584) / 2=0.7 \\ & (0,584,0.86)=0.7 \pm 1,96 \sqrt{\frac{(0.7)(0.3)}{n}} \\ & 0.584=0.7-1.96 \sqrt{\frac{(0.77(0.3)}{n}} \\ & n \approx 60 \text { students }\end{aligned}\)
(b) Since the teacher asking the question is an envirumental science teacher, the students may feel that they need to Show that they recycle regritarly when in reality they might not. Due to this bias, the point estimate of the proportion may be higher than it actually is. This is an example of a response bias.
(c)(i) \(300(0.5)=150\) students
(ii) \(\frac{(300-213)}{300}=0.29\)
Question
The anterior cruciate ligament (ACL) is one of the ligaments that help stabilize the knee. Surgery is often recommended if the ACL is completely torn, and recovery time from the surgery can be lengthy. A medical center developed a new surgical procedure designed to reduce the average recovery time from the surgery. To test the effectiveness of the new procedure, a study was conducted in which 210 patients needing surgery to repair a torn ACL were randomly assigned to receive either the standard procedure or the new procedure.
(a) Based on the design of the study, would a statistically significant result allow the medical center to conclude that the new procedure causes a reduction in recovery time compared to the standard procedure, for patients similar to those in the study? Explain your answer.
(b) Summary statistics on the recovery times from the surgery are shown in the table.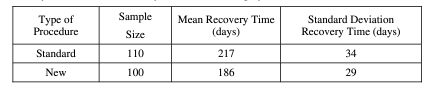
Do the data provide convincing statistical evidence that those who receive the new procedure will have less recovery time from the surgery, on average, than those who receive the standard procedure, for patients similar to those in the study?
▶️Answer/Explanation
Ans:
(a)No, correlation doesn’t prove causation. They could conclude that the new procedure will most likely reduce recover time compared to the standard procedure, for patients similar to those in the study, but they can’t prove that it causes a reduction in recovery time.
(b) Assumptions; \(S R S\), independence, \(n_1 p_1 \geq 10, n_1 q_1 \geq 10, n_2 p_2 \geq 10, n_2 q \geq \geqslant 10\) sample size \(<10 \%\) population
\(\begin{array}{ll}H_0: M_{\text {now }}=M_{\text {standard }} & P\left(z<\frac{186-217}{\sqrt{\frac{29^2}{100}+\frac{34^2}{110}}}\right) \\ H_a: M_{\text {new }}<M_{\text {standard }} & P(z<-7.127) \\ & P \approx 0\end{array}\)
Since \(p\) is so small, we can reject \(H_0\). This means that there is convincing statistical evidence to conclude that those who receive the new procedure will likely have less recovery time from the surgery, on are rage, than those who receive the standard procedure, for patients similar to those in the study.
Question
The following histograms summarize the teaching year for the teachers at two high schools, A and B.
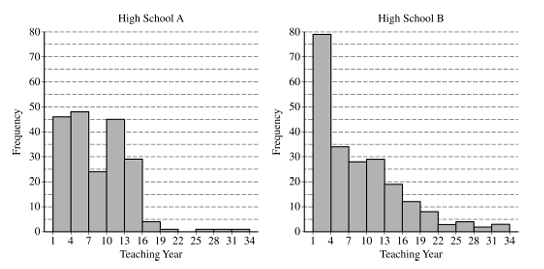
Teaching year is recorded as an integer, with first-year teachers recorded as 1 , second-year teachers recorded as 2 , and so on. Both sets of data have a mean teaching year of 8.2, with data recorded from 200 teachers at High School A and 221 teachers at High School B. On the histograms, each interval represents possible integer values from the left endpoint up to but not including the right endpoint.
(a) The median teaching year for one high school is 6, and the median teaching year for the other high school is 7. Identify which high school has each median and justify your answer.
(b) An additional 18 teachers were not included with the data recorded from the 200 teachers at High School A. The mean teaching year of the 18 teachers is 2.5. What is the mean teaching year for all 218 teachers at High School A?
(c) The standard deviation of the teaching year for the 221 teachers at High School B is 7.2. If one teacher is selected at random from High School B, what is the probability that the teaching year for the selected teacher will be within 1 standard deviation of the mean of 8.2 ? Justify your answer.
▶️Answer/Explanation
Ans:
High school. A has 200 teachers so its median should be the mean of the root and \(101^{\text {th }}\) values when the values are ordered. Based on the chart, about \(<100\) have values below 7 but \(>100\) hove values below io the medianmugt de Jat high school \(A\).
Similarly in high school \(B\) the median of the 221 teachers will be the \(101^{\text {th }}\) value when ordered.
The chert shows there are \(<111\) below 4 and \(>111\) below 7 .
the median must be 6 at high school 8 .
(b)The sum of the 200 teachers in we given chart is \(\mu_1 n_1=8 \cdot 2 \cdot 200=1640\).
The added teachers sum would be \(\mu_{\varepsilon_2}=2.5 \cdot 18=45\) The total would be 1685 years for 218 teachers.
The mean would be
$
\mu_{1,2}=\frac{1640+45}{200+18} \approx 7.73 \text { years }
$
(c)Falling with 7.2 years of 8.2 and being integral means the value must be between \([1,15]\), or equivalent \([1,16)\).
This is the sum of values in the first 5 bors: \(79+34+28+29+19=189\) values \(<16\)
The proportion is \(\frac{189}{221} \approx 0.855\)