
1.10.A.1 First Component: Variable(s) of Interest
The first component of an investigative question identifies the variable or variables that will be measured.
This component guides the data collection process by specifying exactly what information needs to be gathered.
A good investigative question clearly states: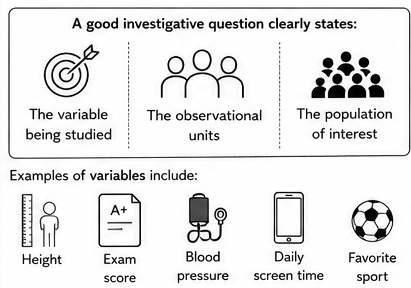
- The variable being studied
- The observational units
- The population of interest
Examples of variables include:
- Height
- Exam score
- Blood pressure
- Daily screen time
- Favorite sport
Without clearly identifying the variable, researchers cannot determine what data should be collected.
| Investigative Question | Variable of Interest |
|---|---|
| How many hours do high school students sleep each night? | Hours of sleep |
| What percentage of adults own electric vehicles? | Vehicle ownership type |
Example
A researcher wants to study the number of hours students spend using social media each day.
Identify the variable of interest in this statistical study.
▶️ Answer / Explanation
The variable of interest is:
Daily hours spent using social media.
This variable determines the data that must be collected from each student.
1.10.A.2 Second Component: Statistical Analysis
The second component identifies how the collected data will be analyzed.
This part of the investigative question determines the appropriate statistical procedure.
Depending on the purpose of the study, researchers may:
- Estimate a population parameter using a confidence interval.
- Test a claim using a hypothesis test.
Therefore, the investigative question should clearly identify the parameter being studied and the statistical objective.
1.10.A.2.i Investigative Questions for Hypothesis Tests
When performing a hypothesis test, the investigative question should clearly specify: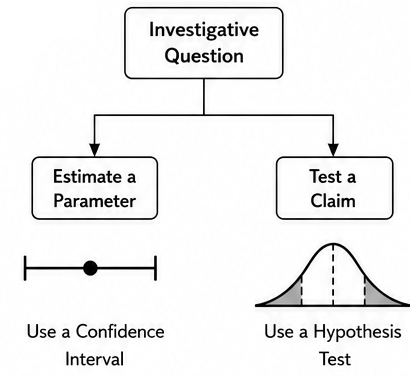
- The population parameter.
- The direction of the alternative hypothesis.
Possible alternative hypotheses include:
- Not equal to (\( \neq \))
- Greater than (\( > \))
- Less than (\( < \))
- Association between variables
- Not independent
A good hypothesis-testing question makes it clear exactly what claim is being investigated.
| Alternative Hypothesis | Example Question |
|---|---|
| Greater Than | Is the average study time greater than 3 hours per day? |
| Less Than | Is the average waiting time less than 10 minutes? |
| Not Equal | Is the average battery life different from 12 hours? |
1.10.A.2.ii Investigative Questions for Confidence Intervals
When constructing a confidence interval, the purpose is not to test a claim but to estimate an unknown population parameter.
The investigative question should clearly identify:
- The population parameter.
- The goal of estimating that parameter within a range of plausible values.
Typical confidence interval questions begin with:
- Estimate…
- Determine the average…
- Estimate the population proportion…
Example
A school district wants to estimate the average number of hours students spend doing homework each night.
Identify the statistical procedure that should be used.
▶️ Answer / Explanation
The goal is to estimate an unknown population mean rather than test a claim.
Therefore, a confidence interval for the population mean is appropriate.
1.10.A.3 Third Component: Population and Type of Conclusion
The third component identifies:
- The population to which the conclusions will apply.
- The type of conclusion that can be drawn from the study.
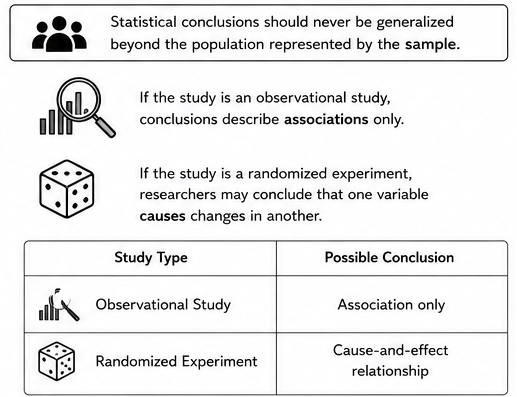
Statistical conclusions should never be generalized beyond the population represented by the sample.
- If the study is an observational study, conclusions describe associations only.
- If the study is a randomized experiment, researchers may conclude that one variable causes changes in another.
| Study Type | Possible Conclusion |
|---|---|
| Observational Study | Association only |
| Randomized Experiment | Cause-and-effect relationship |
Example
A researcher randomly assigns 200 adults to either a new exercise program or their usual routine. After 8 weeks, the researcher compares the average weight loss between the two groups.
Identify the three components of the investigative question.
▶️ Answer / Explanation
Component 1 (Variable of Interest):
Weight loss after 8 weeks.
Component 2 (Statistical Analysis):
Compare the population mean weight loss between the two groups using a hypothesis test.
Component 3 (Population and Conclusion):
The conclusions apply to the population represented by the sampled adults.
Because participants were randomly assigned to treatments, a cause-and-effect conclusion may be made if the results are statistically significant.
1.10.B.1 Census
A census is the process of collecting information from every individual or item in a population.
- Since every member of the population is included, a census provides complete information about the population.
- No sampling is involved because the entire population is measured.
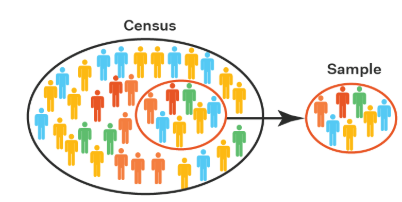
Examples of censuses include:
- Recording the age of every student enrolled in a school.
- Counting every resident living in a country during a national census.
- Measuring the height of every player on a sports team.
Although a census eliminates sampling error, it may not always be practical because:
- The population may be extremely large.
- Collecting data from everyone can be expensive.
- It may require a great deal of time.
- Some populations continually change over time.
| Census | Sample |
|---|---|
| Includes every member of the population | Includes only part of the population |
| Provides complete population information | Provides information used to estimate the population |
| Usually more expensive and time-consuming | Usually faster and less expensive |
| No sampling is performed | Requires selecting a sample |
Important AP Statistics Idea
- A census does not mean collecting a large amount of data.
- A study is considered a census only if every member of the population is included.
- If even one member of the population is excluded, the study is no longer a census.
Example
A principal wants to determine the average number of hours students at a school spend on homework each week.
The principal surveys every student enrolled in the school.
Is this study a census or a sample? Explain your answer.
▶️ Answer / Explanation
This study is a census.
A census collects information from every member of the population.
Since every student in the school was surveyed, the entire population was included.
Therefore, no sampling was performed.
Example
A company has 2,500 employees.
To measure job satisfaction, the company surveys 400 randomly selected employees.
Is this study a census? Explain.
▶️ Answer / Explanation
No.
Only 400 of the 2,500 employees were surveyed.
Since the entire population was not included, the study uses a sample, not a census.
1.10.C.1 Experiment
An experiment is a study in which a researcher assigns conditions, or treatments, to experimental units in order to answer an investigative question about a population.
By assigning treatments, the researcher controls the explanatory variable and observes how the response variable changes. 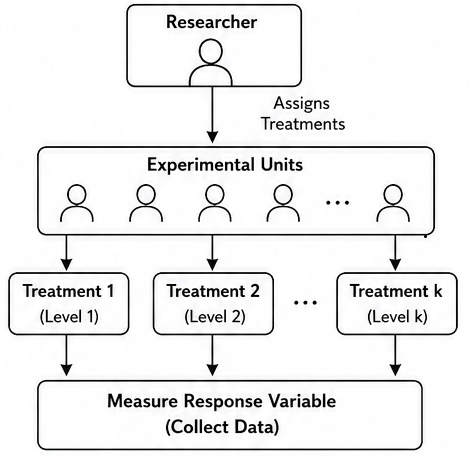
Key Characteristics of an Experiment
- The researcher assigns treatments to the experimental units.
- The purpose is to investigate the effect of one or more treatments.
- A properly designed randomized experiment can provide evidence of a cause-and-effect relationship.
1.10.C.2 Experimental Unit
An experimental unit is the observational unit to which a treatment is assigned.
When the experimental units are people, they are often called subjects or participants.
Examples
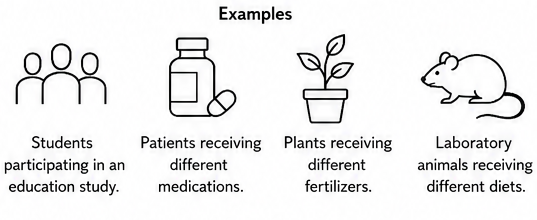
- Students participating in an education study.
- Patients receiving different medications.
- Plants receiving different fertilizers.
- Laboratory animals receiving different diets.
1.10.C.3 Explanatory Variable (Factor) and Treatments
An explanatory variable, also called a factor, is the variable whose categories or levels are deliberately assigned to the experimental units.
- The different categories or levels of the explanatory variable are called treatments.
- If an experiment includes more than one explanatory variable, each unique combination of their levels forms a treatment.
Example
Suppose a researcher studies the effect of fertilizer type on plant growth.
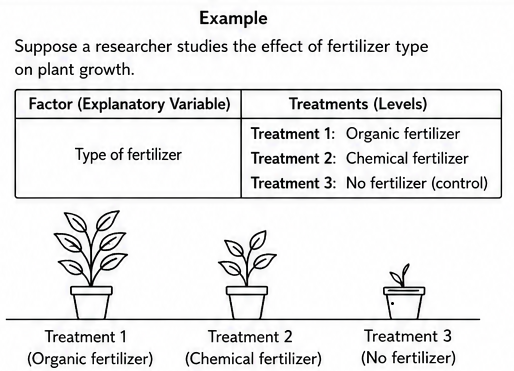
- Factor: Type of fertilizer
- Treatment 1: Organic fertilizer
- Treatment 2: Chemical fertilizer
- Treatment 3: No fertilizer (control)
1.10.C.4 Response Variable
The response variable is the outcome measured on each experimental unit after the treatment has been applied.
The response variable is used to determine whether the treatments have produced different results.
Examples
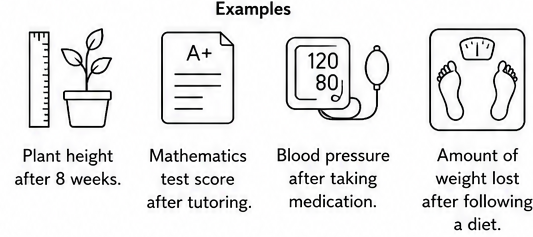
- Plant height after 8 weeks.
- Mathematics test score after tutoring.
- Blood pressure after taking medication.
- Amount of weight lost after following a diet.
| Term | Definition | Example |
|---|---|---|
| Experiment | A study in which treatments are assigned to experimental units. | Assigning different study methods to students. |
| Experimental Unit | The individual receiving a treatment. | Each student. |
| Factor (Explanatory Variable) | The variable whose levels are assigned. | Study method. |
| Treatment | A specific level or combination of levels of the factor(s). | Online tutoring or traditional tutoring. |
| Response Variable | The outcome measured after treatment. | Mathematics test score. |
Important AP Exam Notes
- In an experiment, the researcher assigns treatments to the experimental units.
- The explanatory variable is called a factor in an experiment.
- The levels of a factor are called treatments.
- The response variable is measured after the treatment has been administered.
- Only a properly randomized experiment can support a cause-and-effect conclusion.
Example
A researcher wants to determine whether three different tutoring methods improve mathematics test scores. Sixty students are randomly assigned to one of the following groups:
- Online tutoring
- In-person tutoring
- No tutoring
After four weeks, each student’s mathematics test score is recorded.
Identify the following:
- Experimental units
- Factor (explanatory variable)
- Treatments
- Response variable
▶️ Answer / Explanation
Experimental Units: The 60 students.
Factor (Explanatory Variable): Type of tutoring.
Treatments:
- Online tutoring
- In-person tutoring
- No tutoring
Response Variable: Mathematics test score after four weeks.
Because the researcher randomly assigns students to the tutoring methods, this study is an experiment.
1.10.D.1 Observational Study
An observational study is a study in which treatments are not imposed.

The researcher records the values of the variables of interest without influencing or changing the subjects’ behavior or conditions.
Characteristics of an Observational Study
- No treatments are assigned.
- The researcher only observes and records data.
- Used to identify relationships or associations between variables.
- Cannot by itself establish a cause-and-effect relationship.
1.10.D.2 Prospective Study
A prospective study is an observational study in which the observational units are selected at the present time, and data are collected from the present into the future.
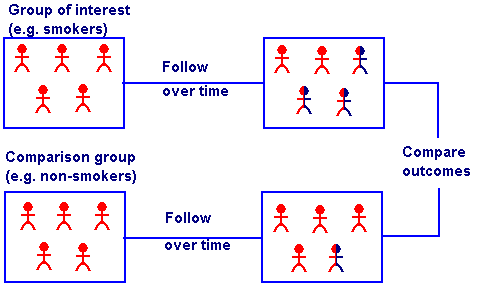
Researchers follow the same individuals over a period of time to observe future outcomes.
Example
A researcher selects 500 adults in 2026 and follows them for the next 10 years to investigate whether exercise habits are associated with heart disease.
1.10.D.3 Retrospective Study
A retrospective study is an observational study in which the observational units are selected at the present time, but information about their past is collected.
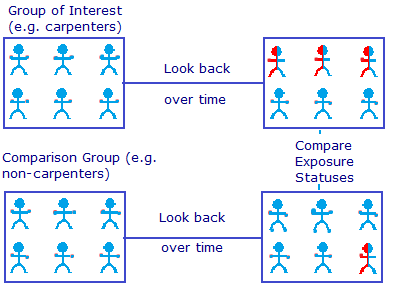
Researchers use existing records, medical files, surveys, or interviews to investigate previous events.
Example
A researcher studies patients diagnosed with lung disease and reviews their smoking histories from the past 20 years.
1.10.D.4 Survey
A survey is an observational study in which data are collected from people using a standard set of questions.
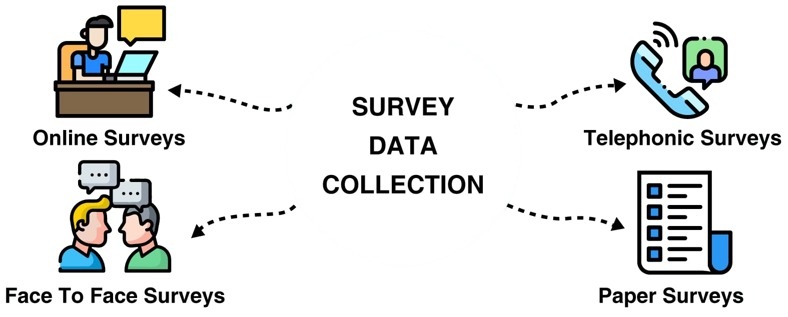
Surveys are commonly used to collect information about opinions, behaviors, preferences, or characteristics of a population.
Example
A school distributes the same questionnaire to 1,000 students asking how many hours they study each week.
1.10.D.5 Confounding Variable
A confounding variable is a variable that provides an alternative explanation for an observed relationship between the explanatory variable and the response variable.
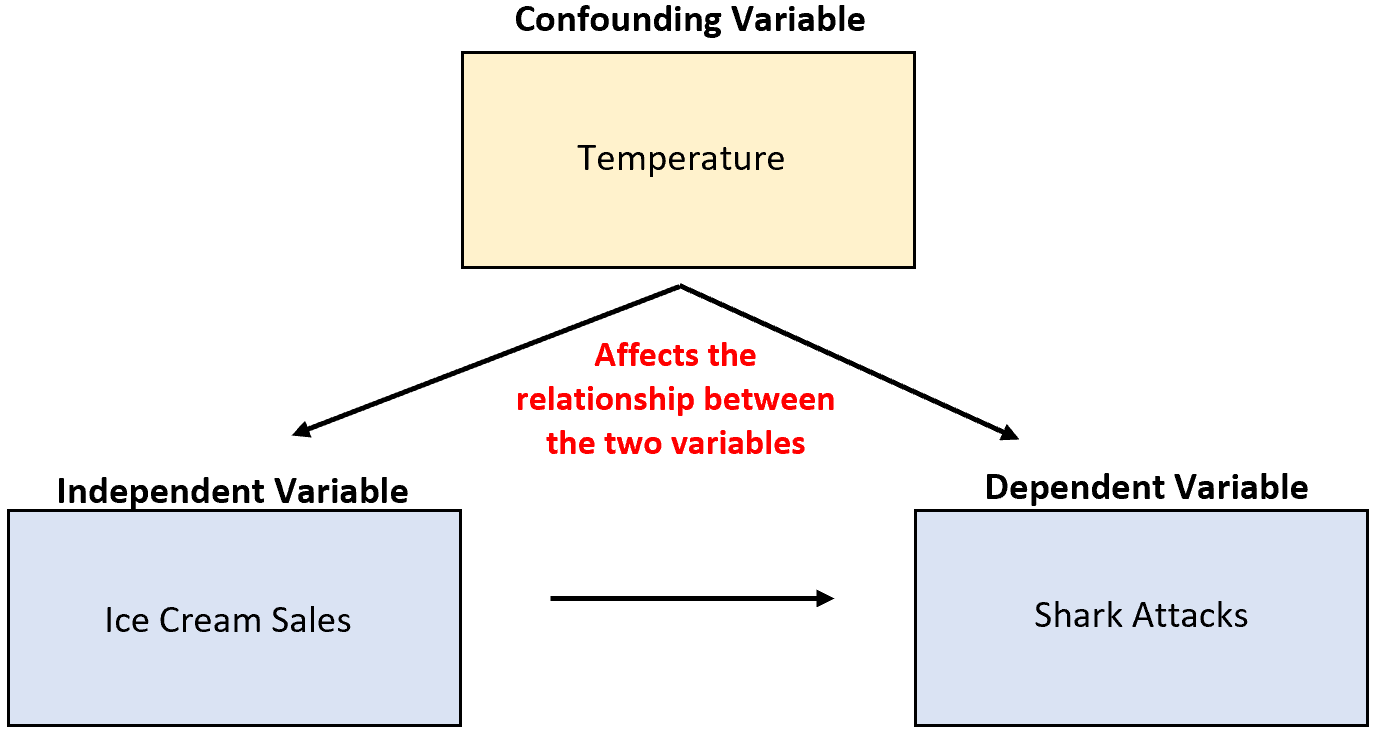
A confounding variable makes it difficult to determine whether the explanatory variable is actually responsible for the observed relationship.
For a variable to be considered a confounding variable, it must satisfy both of the following conditions:
- It is associated with the explanatory variable.
- It is associated with the response variable.
Because confounding variables may influence both variables of interest, observational studies generally cannot establish causation.
Example
- A study finds that students who spend more time studying tend to earn higher exam scores.
- A possible confounding variable is student motivation, because motivated students may both study more and earn higher scores.
| Type of Observational Study | Description | Example |
|---|---|---|
| Observational Study | Researcher observes without assigning treatments. | Recording students’ study habits. |
| Prospective Study | Collects data from the present into the future. | Following patients for 10 years. |
| Retrospective Study | Uses information from the past. | Reviewing medical records. |
| Survey | Collects data using a standard set of questions. | Student opinion questionnaire. |
| Confounding Variable | Provides an alternative explanation for an observed association. | Motivation affecting both study time and exam scores. |
Observational Study vs. Experiment
| Observational Study | Experiment |
|---|---|
| Researcher does not assign treatments. | Researcher assigns treatments. |
| Can identify associations. | Can identify cause-and-effect relationships when properly randomized. |
| Confounding variables may affect results. | Random assignment helps control confounding variables. |
Important AP Exam Notes
- In an observational study, the researcher does not assign treatments.
- Observational studies can identify associations but generally cannot establish causation.
- A prospective study collects data into the future.
- A retrospective study collects information from the past.
- A survey uses a standard set of questions to collect data from people.
- A confounding variable must be associated with both the explanatory variable and the response variable.
Example
A researcher wants to investigate whether people who exercise regularly have lower blood pressure. The researcher records the weekly exercise habits and blood pressure of 800 adults but does not assign any exercise program.
Identify the following:
- The type of study.
- The explanatory variable.
- The response variable.
- One possible confounding variable.
▶️ Answer / Explanation
Type of Study: Observational study.
Explanatory Variable: Weekly exercise habits.
Response Variable: Blood pressure.
Possible Confounding Variable: Age, diet, body weight, or smoking status, because each may be associated with both exercise habits and blood pressure.
Since treatments were not assigned, this study can identify an association but cannot establish a cause-and-effect relationship.
1.10.E.1 Random Samples
A sample is considered random when every observational unit in the sample is selected using a random mechanism.
Examples of random mechanisms include:
- A random number generator.
- A random digit table.
- Drawing names from a hat.
- Lottery-style selection.
Random sampling helps reduce selection bias and increases the likelihood that the sample is representative of the population.
1.10.E.2 Generalizing from a Random Sample
When observational units (or experimental units) are randomly selected from a population, it is appropriate to generalize the results to the entire population from which the sample was selected.
This is because every member of the population had a known chance of being selected, making the sample more representative of the population.
Example
- A random sample of 500 voters is selected from all registered voters in a state.
- The results may be generalized to all registered voters in that state.
1.10.E.3 Nonrandom Samples
A sample is not randomly selected if observational units are: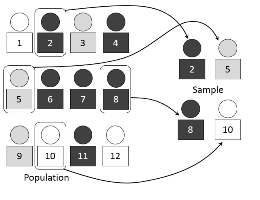
- Deliberately chosen by the researcher.
- Volunteers who choose to participate.
- Conveniently selected because they are easy to reach.
These sampling methods often introduce selection bias, making the sample less representative of the population.
Example
- A teacher asks for volunteers in one class to participate in a study about study habits.
- Because students volunteered, the sample is not random.
1.10.E.4 Generalizing from a Nonrandom Sample
When a sample is not randomly selected, it is generally not appropriate to generalize the results to the entire population.
Instead, the conclusions should be limited to individuals who are similar to those included in the study.
Example
If a study includes only volunteers from one high school, the conclusions should be limited to students similar to those volunteers rather than all high school students.
| Type of Sample | Can Results Be Generalized? | Appropriate Population |
|---|---|---|
| Random Sample | Yes | The entire population from which the sample was selected. |
| Nonrandom Sample | No | Only individuals similar to those in the sample. |
Decision Guide for Generalizations
| Question | Answer |
|---|---|
| Was the sample selected using a random method? | If Yes, generalize to the population. |
| Was the sample selected using volunteers or convenience? | If Yes, limit conclusions to individuals similar to those in the sample. |
Important AP Exam Notes
- Random sampling allows researchers to generalize results to the population.
- Volunteer samples and convenience samples are not random.
- Nonrandom samples should not be used to make conclusions about an entire population.
- Generalizations from nonrandom samples should be limited to individuals who are similar to those in the sample.
- Random selection improves the representativeness of a sample and reduces selection bias.
Example
A researcher uses a random number generator to select 300 students from all students in a school. The researcher surveys these students about the average number of hours they spend on homework each week.
Determine whether the results of the study can be generalized to all students in the school. Justify your answer.
▶️ Answer / Explanation
The sample was selected using a random number generator, so it is a random sample.
Because the students were randomly selected from the entire school population, it is appropriate to generalize the results to all students in the school.
Random sampling helps ensure that the sample is representative of the population.