Definition of a Variable: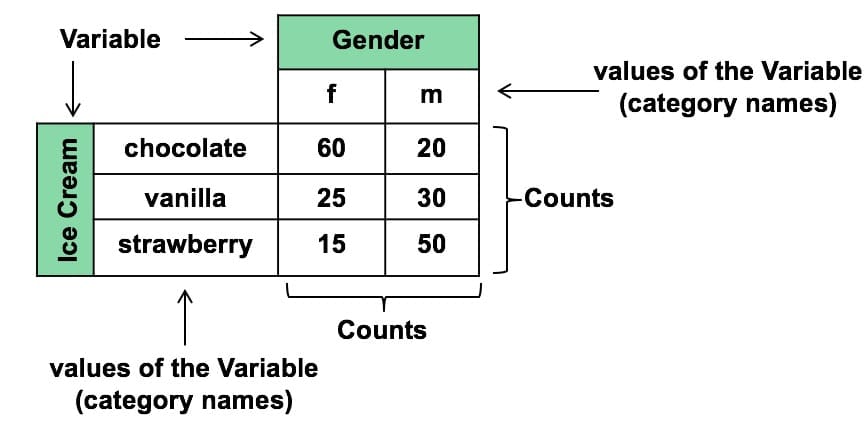
- A variable is a characteristic of an individual that can take different values.
- Every dataset contains one or more variables describing individuals (people, objects, or cases).
Categorical (Qualitative) Variables:
A categorical variable takes on values that are category names or group labels.
Key Features:
- Categories may or may not have a natural ordering.
- Mathematical operations like mean or standard deviation do not make sense.
Subtypes:
- Nominal: Pure labels with no inherent order (e.g., eye color, nationality).
- Ordinal: Categories with a natural order, but differences are not measurable (e.g., satisfaction rating: satisfied, neutral, unsatisfied).
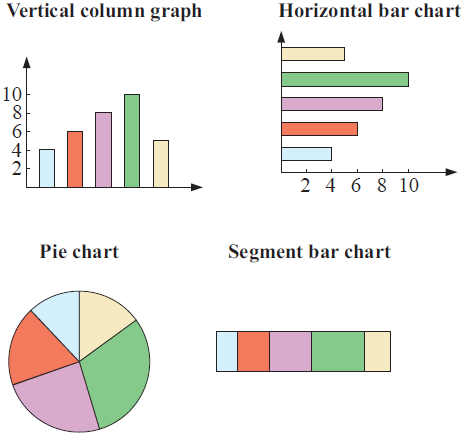
Visual Representations:
Quantitative (Numerical) Variables:
A quantitative variable takes on numerical values that represent a measured or counted quantity.
Key Features:
- Arithmetic operations (mean, variance, standard deviation) are meaningful.
- Used for calculations and statistical modeling.
Subtypes:
- Discrete: Countable whole-number values (e.g., number of siblings, number of books).
- Continuous: Any value within an interval, including decimals (e.g., height, weight, time, temperature).
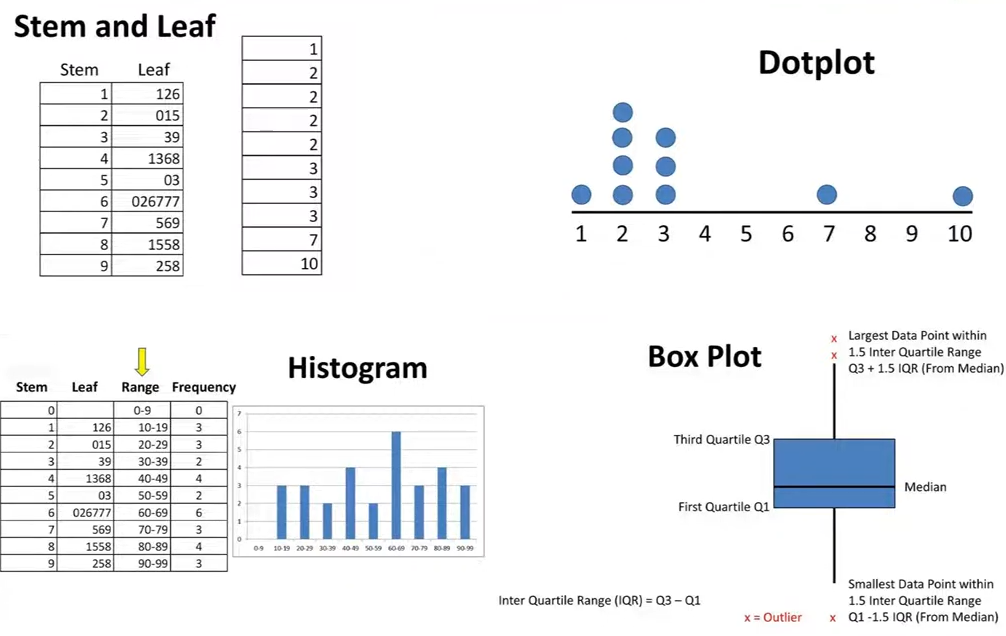
Visual Representations:
Key Differences Between Categorical and Quantitative:
- Categorical variables group individuals, while quantitative variables measure or count a quantity.
- The type of variable determines the appropriate graph and statistical method to use.
Example:
A dataset contains the following variables about college students:
- Major (e.g., Math, History, Biology)
- Year in school (Freshman, Sophomore, Junior, Senior)
- GPA (on a 0–4 scale)
- Number of courses taken this semester
- Daily hours of sleep
Identify and classify each variable as categorical or quantitative.
▶️ Answer/Explanation
Step 1: List and analyze variables.
- Major: Categorical Nominal (labels with no order).
- Year in school: Categorical Ordinal (ordered levels, but not numeric distance).
- GPA: Quantitative Continuous (decimal values between 0 and 4).
- Number of courses: Quantitative Discrete (countable whole numbers).
- Daily hours of sleep: Quantitative Continuous (can take decimals like 6.5 hours).
Step 2: Match with graphs. For categorical variables, bar charts or pie charts work best. For quantitative variables, histograms, boxplots, or scatterplots are more appropriate.
Final Point: Correct classification ensures proper analysis. Using the wrong method (e.g., calculating a mean of “major”) is meaningless.
Identify and Classify Variables
Step 1: Identify variables in a dataset.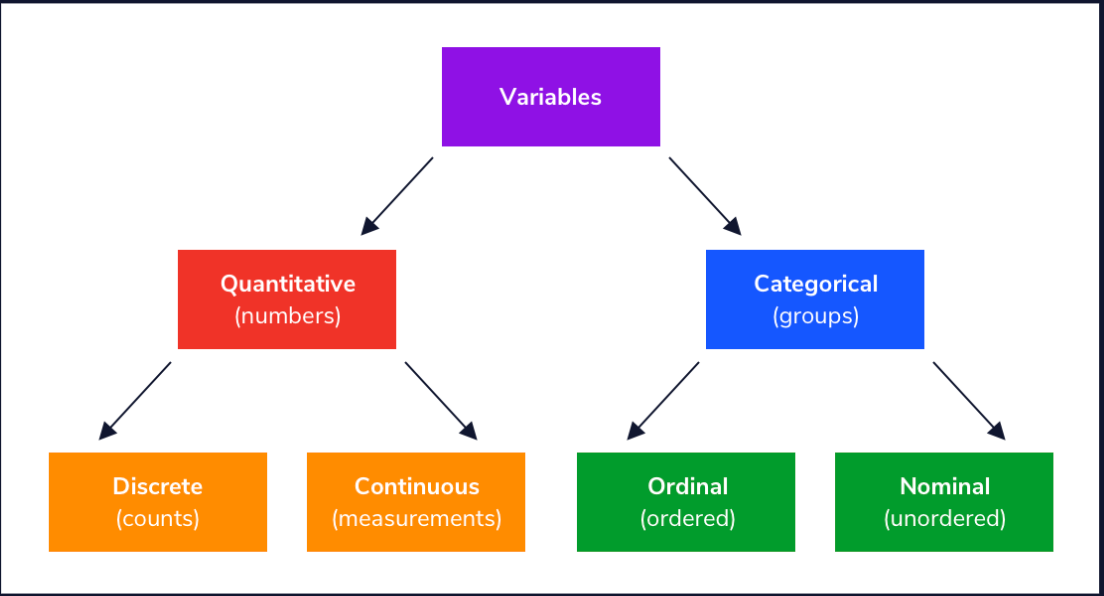
- A variable is any characteristic that can differ from one individual to another.
- Examples: age, gender, height, test score, favorite color.
Step 2: Classify each variable type.
Categorical (Qualitative): Groups or categories, no numerical meaning.
- Examples: gender, type of car, political party, eye color.
Quantitative (Numerical): Numerical values where arithmetic makes sense.
- Discrete: Countable values (e.g., number of pets, number of cars).
- Continuous: Any value within an interval (e.g., weight, time, distance).
Example:
A dataset contains the following information about students: favorite subject, number of siblings, GPA, and height. Identify and classify each variable.
▶️ Answer/Explanation
Step 1: List the variables: favorite subject, number of siblings, GPA, height.
Step 2: Classify each:
- Favorite subject: Categorical (places into groups like Math, Science, History).
- Number of siblings: Quantitative Discrete (countable whole numbers).
- GPA: Quantitative Continuous (can take decimal values between 0 and 4.0).
- Height: Quantitative Continuous (measured on a continuous scale, e.g., 165.4 cm).
Final Point: Correctly identifying variable type is essential for selecting the right statistical method (e.g., bar chart for categorical vs histogram for quantitative).
Example:
A medical researcher records the following information from a group of patients:
- Blood type (A, B, AB, O)
- Age (in years)
- Cholesterol level (mg/dL)
- Smoker status (Yes/No)
Identify and classify each variable as categorical or quantitative, and if quantitative, specify whether it is discrete or continuous.
▶️ Answer/Explanation
- Blood type: Categorical Nominal (labels with no order).
- Age: Quantitative Continuous (measured, can be decimals like 25.5 years).
- Cholesterol level: Quantitative Continuous (measured, decimal possible).
- Smoker status: Categorical (binary: Yes/No).
Final Point: Recognizing whether a variable is categorical or quantitative determines the type of summary statistics and graphs we should use.
Example:
A survey is conducted among high school students, collecting the following data:
- Favorite subject (Math, Science, History, English)
- Number of text messages sent per day
- Height (in cm)
- Class rank (1st, 2nd, 3rd, …)
Classify each variable as categorical or quantitative, and specify the subtype where applicable.
▶️ Answer/Explanation
- Favorite subject: Categorical Nominal (no order).
- Number of text messages: Quantitative Discrete (countable whole numbers).
- Height: Quantitative Continuous (measured on a scale, decimals possible).
- Class rank: Categorical Ordinal (ordered, but differences are not meaningful in size).
Final Point: Some variables (like rank) may look numeric but are actually categorical with order. Always check whether arithmetic operations make sense.