
2.2.A.1 Joint Relative Frequency
In a two-way table, a joint relative frequency represents the proportion (or percentage) of the entire data set that falls into a specific combination of categories for two categorical variables.
It is calculated by dividing the frequency in a cell by the grand total (the total number of observations in the table).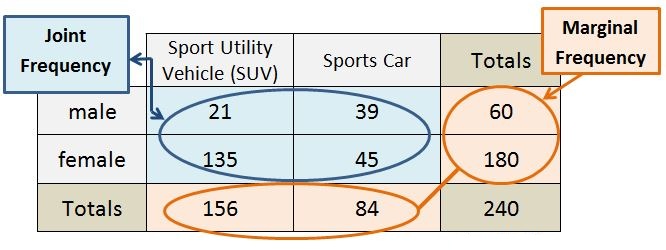
Joint relative frequencies describe how common a particular combination of categories is within the entire population or sample.
Formula
\( \text{Joint Relative Frequency}=\dfrac{\text{Cell Frequency}}{\text{Grand Total}} \)
Where:
- Cell Frequency = Number of observations in one cell of the table.
- Grand Total = Total number of observations in the entire table.
Example Two-Way Table
| Grade Level | Online | In-Person | Total |
|---|---|---|---|
| Freshmen | 50 | 30 | 80 |
| Sophomores | 40 | 80 | 120 |
| Total | 90 | 110 | 200 |
Calculating a Joint Relative Frequency
Find the joint relative frequency for Freshmen who prefer Online learning.
Step 1: Identify the cell frequency.
Cell Frequency = 50
Step 2: Identify the grand total.
Grand Total = 200
Step 3: Apply the formula.
\( \dfrac{50}{200}=0.25 \)
Interpretation
Approximately 25% of all students in the survey were Freshmen who preferred Online learning.
Important AP Exam Notes
- A joint relative frequency always uses the grand total as the denominator.
- It represents the proportion of the entire data set that belongs to a specific combination of categories.
- Joint relative frequencies may be written as a decimal, fraction, or percentage.
- Do not divide by a row total or column total—that would calculate a conditional relative frequency instead.
Common AP Exam Mistakes
| Incorrect Calculation | Correct Calculation |
|---|---|
| Divide by the row total. | Divide by the grand total. |
| Divide by the column total. | Divide by the grand total. |
| Use the row percentage. | Use the overall proportion of the entire table. |
Example
The table below summarizes students’ preferred learning method by grade level.
| Grade Level | Online | In-Person | Total |
|---|---|---|---|
| Freshmen | 50 | 30 | 80 |
| Sophomores | 40 | 80 | 120 |
| Total | 90 | 110 | 200 |
Calculate the joint relative frequency of students who are Sophomores and prefer In-Person learning.
▶️ Answer / Explanation
Step 1: Identify the cell frequency.
80
Step 2: Identify the grand total.
200
Step 3: Apply the formula.
\( \text{Joint Relative Frequency}=\dfrac{80}{200}=0.40 \)
Answer
The joint relative frequency is
\(0.40\) or 40%.
This means that 40% of all students surveyed were Sophomores who preferred In-Person learning.
2.2.A.2 Marginal Relative Frequency
In a two-way table, a marginal relative frequency represents the proportion (or percentage) of observations that belong to a single category of one variable, regardless of the categories of the other variable.
Marginal relative frequencies are calculated using the row totals or column totals of the table.
They summarize the distribution of one categorical variable without considering the second variable.
Formula
If using a row total:
\( \text{Marginal Relative Frequency}=\dfrac{\text{Row Total}}{\text{Grand Total}} \)
If using a column total:
\( \text{Marginal Relative Frequency}=\dfrac{\text{Column Total}}{\text{Grand Total}} \)
Where:
- Row Total = Total number of observations in one row.
- Column Total = Total number of observations in one column.
- Grand Total = Total number of observations in the entire table.
Example Two-Way Table
| Grade Level | Online | In-Person | Total |
|---|---|---|---|
| Freshmen | 50 | 30 | 80 |
| Sophomores | 40 | 80 | 120 |
| Total | 90 | 110 | 200 |
Example 1: Row Marginal Relative Frequency
Find the marginal relative frequency of Freshmen.
Step 1: Identify the row total.
Row Total = 80
Step 2: Identify the grand total.
Grand Total = 200
Step 3: Apply the formula.
\( \dfrac{80}{200}=0.40 \)
Interpretation
40% of all students surveyed are Freshmen.
Example 2: Column Marginal Relative Frequency
Find the marginal relative frequency of students who prefer Online learning.
Step 1: Identify the column total.
Column Total = 90
Step 2: Identify the grand total.
Grand Total = 200
Step 3: Apply the formula.
\( \dfrac{90}{200}=0.45 \)
Interpretation
45% of all students surveyed prefer Online learning.
Joint vs. Marginal Relative Frequency
| Type | Formula | Describes |
|---|---|---|
| Joint Relative Frequency | Cell ÷ Grand Total | A specific combination of two categories. |
| Marginal Relative Frequency | Row Total or Column Total ÷ Grand Total | The distribution of one variable only. |
Important AP Exam Notes
- A marginal relative frequency always uses the grand total as the denominator.
- Use either a row total or a column total, depending on the variable of interest.
- Marginal relative frequencies describe one categorical variable without considering the second variable.
- Do not use an individual cell frequency when calculating a marginal relative frequency.
Common AP Exam Mistakes
| Incorrect Calculation | Correct Calculation |
|---|---|
| Cell ÷ Grand Total | This is a Joint Relative Frequency. |
| Cell ÷ Row Total | This is a Conditional Relative Frequency. |
| Row Total or Column Total ÷ Grand Total | This is a Marginal Relative Frequency. |
Example
The table below summarizes students’ preferred learning method by grade level.
| Grade Level | Online | In-Person | Total |
|---|---|---|---|
| Freshmen | 50 | 30 | 80 |
| Sophomores | 40 | 80 | 120 |
| Total | 90 | 110 | 200 |
Calculate the following marginal relative frequencies:
- Students who are Sophomores.
- Students who prefer In-Person learning.
▶️ Answer / Explanation
1. Sophomores
\( \dfrac{120}{200}=0.60 \)
Therefore, 60% of all students surveyed are Sophomores.
2. In-Person Learning
\( \dfrac{110}{200}=0.55 \)
Therefore, 55% of all students surveyed prefer In-Person learning.
2.2.A.3 Conditional Relative Frequency
A conditional relative frequency describes the proportion (or percentage) of observations that fall into a particular category, given that the observations belong to a specific row or column.
Unlike joint and marginal relative frequencies, a conditional relative frequency does not use the grand total as the denominator.
Instead, the denominator is either the row total or the column total, depending on the condition being considered.
Conditional relative frequencies are used to compare the distributions of one categorical variable across the levels of another categorical variable.
Formulas
Row Conditional Relative Frequency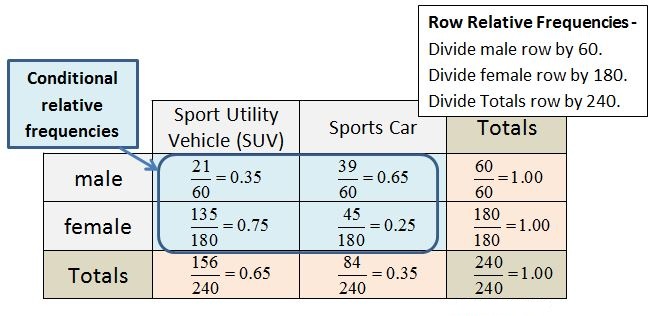
\( \text{Conditional Relative Frequency}=\dfrac{\text{Cell Frequency}}{\text{Row Total}} \)
Column Conditional Relative Frequency
\( \text{Conditional Relative Frequency}=\dfrac{\text{Cell Frequency}}{\text{Column Total}} \)
Where:
- Cell Frequency = Frequency in the selected cell.
- Row Total = Total frequency for that row.
- Column Total = Total frequency for that column.
Example Two-Way Table
| Grade Level | Online | In-Person | Total |
|---|---|---|---|
| Freshmen | 50 | 30 | 80 |
| Sophomores | 40 | 80 | 120 |
| Total | 90 | 110 | 200 |
Example 1: Row Conditional Relative Frequency
Among Freshmen, what proportion prefer Online learning?
Step 1: Identify the cell frequency.
50
Step 2: Identify the row total.
80
Step 3: Apply the formula.
\( \dfrac{50}{80}=0.625 \)
Interpretation
62.5% of Freshmen prefer Online learning.
Example 2: Column Conditional Relative Frequency
Among students who prefer Online learning, what proportion are Freshmen?
Step 1: Identify the cell frequency.
50
Step 2: Identify the column total.
90
Step 3: Apply the formula.
\( \dfrac{50}{90}=0.556 \)
Interpretation
Approximately 55.6% of students who prefer Online learning are Freshmen.
Comparison of Relative Frequencies
| Type | Formula | Denominator |
|---|---|---|
| Joint Relative Frequency | Cell ÷ Grand Total | Grand Total |
| Marginal Relative Frequency | Row Total or Column Total ÷ Grand Total | Grand Total |
| Conditional Relative Frequency | Cell ÷ Row Total or Cell ÷ Column Total | Row Total or Column Total |
Important AP Exam Notes
- A conditional relative frequency is calculated by restricting the data to a particular row or column.
- The denominator is not the grand total.
- Conditional relative frequencies are used to compare the distributions of one categorical variable across the categories of another variable.
- AP Statistics questions about association almost always require comparing conditional relative frequencies.
- Always read the question carefully to determine whether the condition refers to a row or a column.
Common AP Exam Mistakes
| Incorrect Calculation | Correct Calculation |
|---|---|
| Cell ÷ Grand Total | This gives a Joint Relative Frequency. |
| Row Total ÷ Grand Total | This gives a Marginal Relative Frequency. |
| Using the wrong row or column total. | Use the total corresponding to the stated condition. |
Example
The table below summarizes students’ preferred learning method by grade level.
| Grade Level | Online | In-Person | Total |
|---|---|---|---|
| Freshmen | 50 | 30 | 80 |
| Sophomores | 40 | 80 | 120 |
| Total | 90 | 110 | 200 |
Calculate the following conditional relative frequencies:
- Among Sophomores, what proportion prefer In-Person learning?
- Among students who prefer Online learning, what proportion are Freshmen?
▶️ Answer / Explanation
1. Among Sophomores
The condition is Sophomores, so use the row total (120).
\( \dfrac{80}{120}=0.667 \)
Therefore, approximately 66.7% of Sophomores prefer In-Person learning.
2. Among Online Learners
The condition is Online learning, so use the column total (90).
\( \dfrac{50}{90}=0.556 \)
Therefore, approximately 55.6% of students who prefer Online learning are Freshmen.