
2.3.A.1 Random Process
A random process is an experiment or activity in which the result is determined entirely by chance, rather than being known in advance.
Although the possible outcomes are known before the experiment begins, it is impossible to predict with certainty which outcome will occur on any single trial.
Random processes are the foundation of probability because they produce outcomes that occur unpredictably.
Characteristics of a Random Process
- The outcome is determined by chance.
- All possible outcomes are known before the experiment begins.
- The exact outcome cannot be predicted with certainty.
- The process can usually be repeated many times under the same conditions.
| Random Process | Possible Outcomes |
|---|---|
| Rolling a six-sided die | 1, 2, 3, 4, 5, 6 |
| Flipping a coin | Heads, Tails |
| Drawing one card from a deck | Any of the 52 cards |
Important AP Exam Notes
- A random process produces outcomes determined by chance.
- The possible outcomes are known before the experiment.
- The exact result of a single trial cannot be predicted.
- Random processes are used to model real-world probability situations.
Example
Identify whether the following describes a random process.
“A student rolls a fair six-sided die and records the number that appears.”
▶️ Answer / Explanation
Yes.
Rolling a fair die is a random process because the result is determined by chance, all six possible outcomes are known beforehand, and the exact outcome cannot be predicted before the die is rolled.
2.3.A.2 Outcome
An outcome is the result of one trial of a random process.
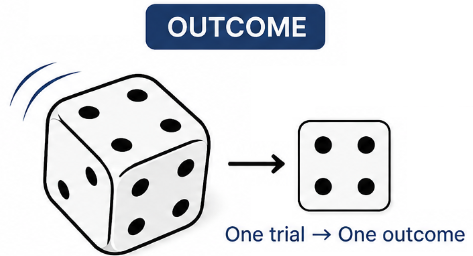
- Each time a random process is performed, exactly one outcome occurs.
- An outcome is a single possible result from the experiment.
Examples of Outcomes
| Random Process | Example of One Outcome |
|---|---|
| Flip a coin | Heads |
| Roll a die | 4 |
| Draw one card | Ace of Hearts |
Important AP Exam Notes
- An outcome is the result of one trial.
- Only one outcome occurs each time the experiment is performed.
- An event may contain one or more outcomes.
Example
A fair six-sided die is rolled once.
Identify one possible outcome.
▶️ Answer / Explanation
One possible outcome is 5.
This is one of the six possible results that can occur from a single roll of the die.
2.3.A.3 Event
An event is a collection (set) of one or more outcomes from a random process.
An event occurs whenever the outcome of the random process belongs to the specified collection of outcomes.
An event may contain:
- One outcome.
- Several outcomes.
- All possible outcomes.
Examples of Events
| Random Process | Event | Outcomes in the Event |
|---|---|---|
| Roll one die | Roll an even number | 2, 4, 6 |
| Flip one coin | Get Heads | Heads |
| Draw one card | Draw a Heart | All 13 Heart cards |
Outcome vs. Event
| Outcome | Event |
|---|---|
| A single result of one trial. | A collection of one or more outcomes. |
| Example: Rolling a 4. | Example: Rolling an even number (2, 4, 6). |
Important AP Exam Notes
- An event consists of one or more outcomes.
- An event occurs if the observed outcome belongs to the specified set.
- Probability is assigned to events, which may contain multiple outcomes.
Example
A fair six-sided die is rolled once.
Identify the outcomes that make up the event:
“Rolling a number greater than 4.”
▶️ Answer / Explanation
The possible outcomes greater than 4 are:
5, 6
Therefore, the event consists of the outcomes
{5, 6}
If either 5 or 6 is rolled, the event occurs.
2.3.A.4 Simulation
A simulation is a method used to imitate a real-world random process by using another random process that is easier to perform.
Simulations are especially useful when calculating theoretical probabilities is difficult or when conducting the actual experiment is expensive, time-consuming, or impractical.
In a simulation, every possible outcome of the real-world event is assigned to a random mechanism (such as random digits, a spinner, a coin, or a random number generator).
The simulation is repeated many times, and the results are recorded to estimate the probability of an event.

Purpose of a Simulation
- Model a real-world random process.
- Estimate probabilities.
- Study events that are difficult or expensive to observe directly.
- Predict long-run behavior using repeated random trials.
Steps for Conducting a Simulation
- Describe the real-world random process.

- Assign each possible outcome to a random device (random digits, cards, spinner, etc.).
- Perform one trial of the simulation.
- Record the outcome.
- Repeat the simulation many times.
- Count how many times the event of interest occurs.
- Estimate the probability using the relative frequency.
Simulation Probability Formula
\( \text{Estimated Probability}=\dfrac{\text{Number of Times the Event Occurred}}{\text{Total Number of Simulation Trials}} \)
Example of Assigning Random Digits
A bag contains 3 red marbles and 2 blue marbles. One marble is selected at random.
To simulate this process using random digits:
| Random Digit | Assigned Outcome |
|---|---|
| 0, 1, 2 | Red Marble |
| 3, 4 | Blue Marble |
Each random digit represents one possible outcome of the real experiment.
Recording Simulation Results
Suppose the simulation is performed 20 times.
| Outcome | Count |
|---|---|
| Red | 13 |
| Blue | 7 |
| Total Trials | 20 |
The estimated probability of selecting a red marble is
\( \dfrac{13}{20}=0.65 \)
Important AP Exam Notes
- A simulation should accurately represent the real-world random process.
- Every possible outcome must be assigned to the simulation.
- Each simulation trial should be independent of the others.
- Record both the count of the event and the total number of trials.
- The estimated probability is based on the relative frequency from the simulation.
- Increasing the number of simulation trials generally improves the accuracy of the probability estimate.
Common AP Exam Mistakes
| Incorrect Practice | Correct Practice |
|---|---|
| Assigning unequal random digits for equally likely outcomes. | Assign digits proportional to the actual probabilities. |
| Not recording every trial. | Record every simulated outcome. |
| Using only a few trials. | Use many trials to improve the estimate. |
Example
A bag contains 3 red marbles and 2 blue marbles. Instead of drawing actual marbles, a student performs a simulation using random digits.
The student assigns:
- 0, 1, and 2 → Red
- 3 and 4 → Blue
The simulation is repeated 50 times, and the student records 31 red outcomes.
Estimate the probability of selecting a red marble using the simulation.
▶️ Answer / Explanation
Step 1: Count the number of successful outcomes.
Red outcomes = 31
Step 2: Count the total number of simulation trials.
Total trials = 50
Step 3: Calculate the estimated probability.
\( \text{Estimated Probability}=\dfrac{31}{50}=0.62 \)
Answer
The estimated probability of selecting a red marble is
\(0.62\) or 62%.
This estimate is based on the relative frequency obtained from the simulation.
2.3.A.5 Probability as Long-Run Relative Frequency
The probability of an outcome or event is its long-run relative frequency. This means that if a random process is repeated many times under identical conditions, the proportion of times an outcome or event occurs will approach its true probability.
Although results from a few trials may vary considerably, the relative frequency becomes more stable as the number of trials increases.
Formula
\( \text{Relative Frequency}=\dfrac{\text{Number of Times the Event Occurred}}{\text{Total Number of Trials}} \)
As the number of trials becomes very large,
\( \text{Relative Frequency}\rightarrow\text{Probability} \)
Example
A fair coin is flipped 1,000 times.
| Outcome | Frequency | Relative Frequency |
|---|---|---|
| Heads | 507 | \( \frac{507}{1000}=0.507 \) |
| Tails | 493 | \( \frac{493}{1000}=0.493 \) |
The theoretical probability of getting Heads is \(0.50\). The simulated relative frequency of \(0.507\) is very close because many trials were performed.
Important AP Exam Notes
- Probability is interpreted as a long-run relative frequency.
- Relative frequencies become better estimates as the number of trials increases.
- Small numbers of trials can produce results that differ noticeably from the true probability.
Example
A die is rolled 600 times and a 4 appears 94 times.
Estimate the probability of rolling a 4 using the long-run relative frequency.
▶️ Answer / Explanation
The estimated probability is
\( \dfrac{94}{600}=0.157 \)
This relative frequency estimates the true probability of rolling a 4.
2.3.A.6 Estimating Probability Using Empirical Relative Frequency
Empirical probability is an estimate of probability obtained from observed data or repeated experiments.
Instead of using theoretical calculations, empirical probability uses the relative frequency observed in actual data.
The more observations collected, the more reliable the estimate generally becomes.
Formula
\( \text{Empirical Probability}=\dfrac{\text{Number of Times the Event Occurred}}{\text{Total Number of Observations}} \)
Example
A basketball player attempts 250 free throws and successfully makes 195.
The estimated probability of making a free throw is
\( \dfrac{195}{250}=0.78 \)
This empirical probability estimates the player’s true probability of making a free throw.
Important AP Exam Notes
- Empirical probability comes from observed data.
- It is an estimate, not necessarily the exact probability.
- Larger data sets generally produce better estimates.
Example
During the past year, it rained on 112 out of 365 days in a city.
Use the empirical data to estimate the probability that it rains on a randomly selected day.
▶️ Answer / Explanation
The empirical probability is
\( \dfrac{112}{365}=0.307 \)
Therefore, the estimated probability that it rains on a randomly selected day is approximately 0.307 (30.7%).
2.3.A.7 Law of Large Numbers
The Law of Large Numbers states that for independent trials, as the number of trials increases, the long-run relative frequency of an outcome or event approaches its true probability.
This law explains why simulations and repeated experiments become more accurate when many trials are performed.
It does not guarantee that short-run results will match the theoretical probability.
Illustration
| Number of Coin Flips | Relative Frequency of Heads |
|---|---|
| 10 | 0.70 |
| 100 | 0.54 |
| 1,000 | 0.503 |
| 10,000 | 0.499 |
Notice that as the number of trials increases, the relative frequency gets closer to the true probability of 0.50.
Important AP Exam Notes
- The Law of Large Numbers applies only to independent trials.
- More trials lead to more stable relative frequencies.
- It does not mean that outcomes will alternate evenly in the short run.
- The law explains why simulations improve with larger sample sizes.
- This law does not imply that previous outcomes affect future outcomes.
Example
A student claims that after flipping a fair coin 10,000 times, the proportion of Heads should be very close to 0.50.
Explain why this claim is reasonable.
▶️ Answer / Explanation
Because the coin flips are independent, the Law of Large Numbers states that as the number of trials increases, the relative frequency of Heads approaches its true probability of 0.50.
Therefore, after 10,000 flips, the observed proportion of Heads should be very close to 0.50, although it may not be exactly equal to 0.50.