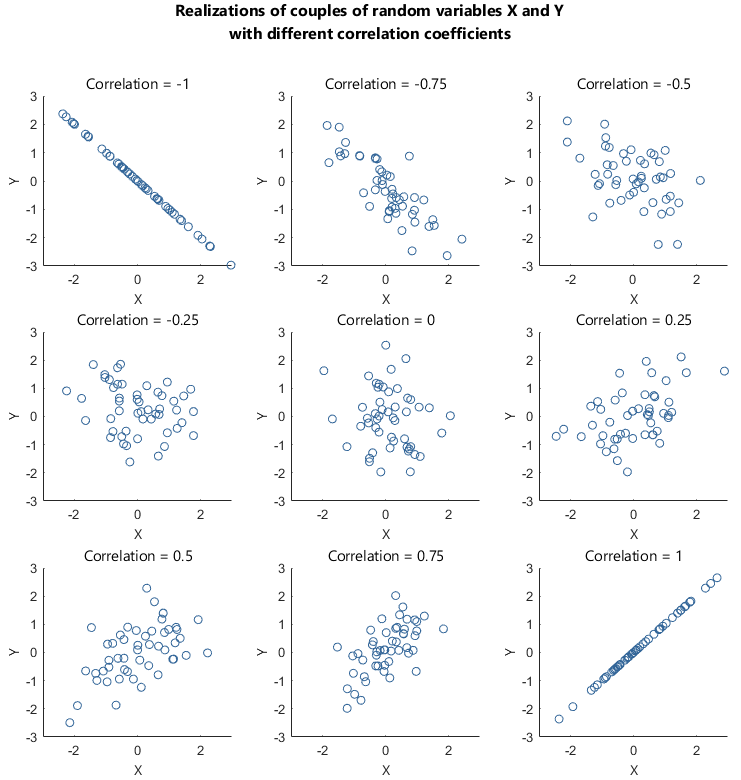
Determine the Correlation for a Linear Relationship
The correlation coefficient, denoted as \( r \), is a numerical measure of the strength and direction of a linear relationship between two quantitative variables.
Formula:
\( r = \dfrac{1}{n-1} \sum \left( \dfrac{x_i – \bar{x}}{s_x} \right)\left( \dfrac{y_i – \bar{y}}{s_y} \right) \)
- \( x_i, y_i \): the data values
- \( \bar{x}, \bar{y} \): means of x and y
- \( s_x, s_y \): standard deviations of x and y
- \( n \): number of data pairs
Properties of Correlation:
- \(-1 \leq r \leq 1\)
- \(r > 0\): positive linear relationship.
- \(r < 0\): negative linear relationship.
- \(r \approx 0\): little or no linear relationship.
- Closer \(|r|\) is to 1, the stronger the linear association.
- Correlation has no units and is unaffected by changes in scale or units of measurement.
Example
A teacher collects data on hours studied (x) and test scores (y) for 5 students:
| Student | Hours Studied (x) | Score (y) |
|---|---|---|
| A | 2 | 65 |
| B | 4 | 70 |
| C | 5 | 75 |
| D | 7 | 85 |
| E | 9 | 95 |
Estimate the correlation between hours studied and exam scores.
▶️ Answer / Explanation
Step 1: The scatterplot of these points would show an upward linear trend.
Step 2: Using the formula for \(r\), the computed value is approximately \( r \approx 0.97 \).
Step 3: Interpretation — This is a very strong, positive linear relationship. As study hours increase, test scores tend to increase.
Interpret the Correlation for a Linear Relationship
The correlation coefficient, \(r\), measures the direction and strength of a linear relationship between two quantitative variables.
Interpretation: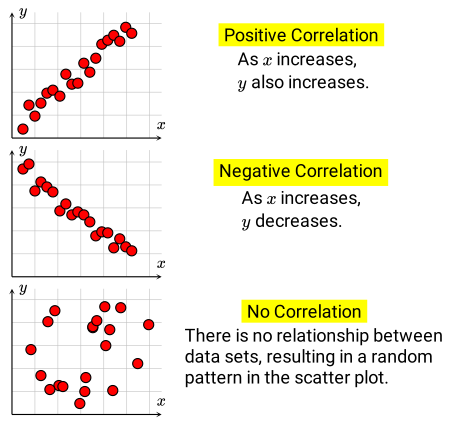
Direction:
- If \(r > 0\), the variables have a positive association (as one increases, the other increases).
- If \(r < 0\), the variables have a negative association (as one increases, the other decreases).
Strength:
- \(|r|\) close to 1 → strong linear relationship.
- \(|r|\) moderate (around 0.4–0.7) → moderate relationship.
- \(|r|\) near 0 → weak or no linear relationship.
Important Notes:
- Correlation only describes linear relationships (not curved patterns).
- Correlation is unitless, unaffected by scaling or shifting the data.
- Correlation does not imply causation — even with a strong \(r\).
Example
A study measures hours of exercise per week and VO₂ max (a fitness measure) for 30 people. The correlation is reported as \( r = 0.82 \).
How do you interpret this correlation?
▶️ Answer / Explanation
Direction: Positive, because \( r > 0 \). More exercise is associated with higher VO₂ max.
Strength: Strong, since \( |r| = 0.82 \) is close to 1.
Conclusion: There is a strong positive linear association between weekly exercise and fitness level. However, we cannot conclude that exercise directly causes higher VO₂ max from correlation alone.
Example
Researchers compare shoe size and IQ scores in a random sample of students. The correlation is \( r = -0.12 \).
How should this correlation be interpreted?
▶️ Answer / Explanation
Direction: Slightly negative (since \( r < 0 \)), but the value is close to zero.
Strength: Very weak — \( |r| = 0.12 \) indicates almost no linear relationship.
Conclusion: Shoe size and IQ are essentially unrelated. The small negative value is likely due to random variation.