Represent Differences Between Measured and Predicted Responses Using Residual Plots
The residual for a data point is the difference between the observed response value and the predicted value from the regression line: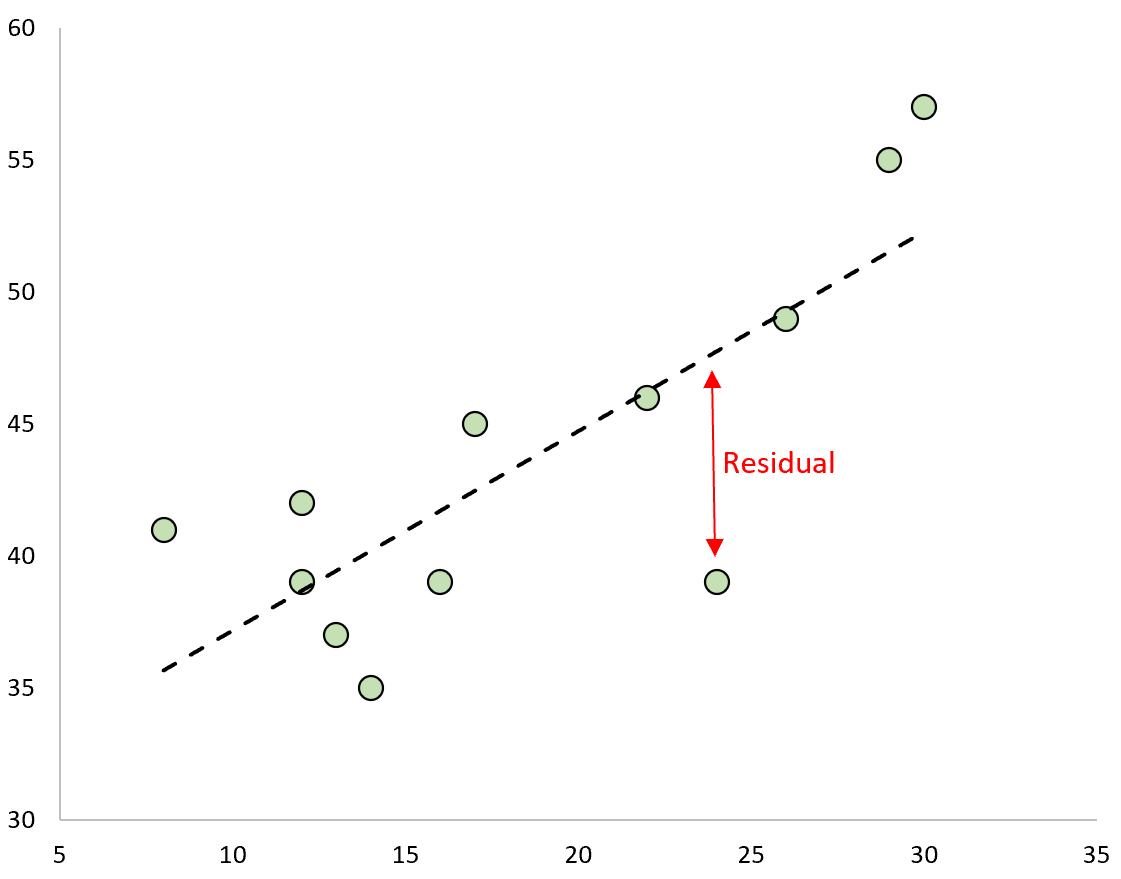
\( \displaystyle e = y – \hat{y} \)
Residual Plot:
- A residual plot graphs residuals \(e\) on the vertical axis against the explanatory variable \(x\) (or against predicted values \(\hat{y}\)).
- It helps assess whether a linear regression model is appropriate.
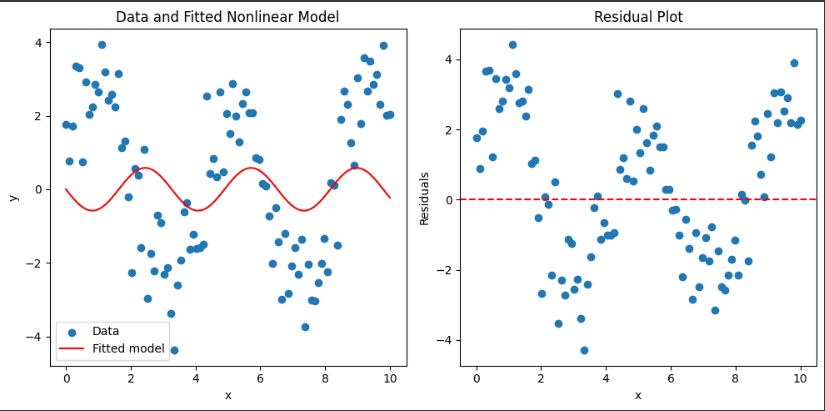
How to Interpret a Residual Plot:
- If residuals are randomly scattered around zero → the linear model is appropriate.
- If residuals show a clear curved pattern → a linear model is not appropriate (consider nonlinear).
- If residuals fan out or cluster → possible nonconstant variability (heteroscedasticity).
- Outliers in the residual plot → unusual data points with large deviations.
Example
Regression equation: \( \hat{y} = 54.15 + 4.42x \), where \(x\) = hours studied, \(y\) = exam score.
For a student who studied 6 hours, the observed score was 85.
Compute the residual and explain what it represents on the residual plot.
▶️ Answer / Explanation
Step 1 — compute predicted value:
\( \hat{y}(6) = 54.15 + 4.42(6) \approx 80.67 \).
Step 2 — compute residual:
\( e = y – \hat{y} = 85 – 80.67 = 4.33 \).
Interpretation: The student scored 4.33 points above the predicted score. On a residual plot, this point would appear at \(x=6, e=+4.33\).
Example
A regression is fit to predict car fuel efficiency (mpg) from engine size (liters). The residual plot shows a clear U-shape: residuals are negative for very small and very large engines, but positive in the middle range.
What does this pattern indicate about the model?
▶️ Answer / Explanation
Interpretation:
- The U-shaped pattern means the linear model systematically underpredicts at the extremes and overpredicts in the middle.
- This indicates that a nonlinear relationship (e.g., quadratic) may be more appropriate.
- Residual plots should be checked to validate model assumptions before using the regression line for predictions.
Describe the Form of Association of Bivariate Data Using Residual Plots
Residual plots show whether a linear model is appropriate to describe the association between two quantitative variables.
Using Residual Plots to Assess Form:
- Linear Form: If residuals are scattered randomly around the horizontal line \( e=0 \) with no pattern → a linear model is appropriate.
- Nonlinear Form: If residuals show a curve (U-shape, inverted U, or other systematic pattern) → a nonlinear model fits better.
- Other Clues:
- Fanning out (wider spread at one end) → non-constant variance (heteroscedasticity).
- Outliers (isolated points far from the band) → unusual observations may affect the form of association.
Example
A regression is run to predict exam score (\(y\)) from hours studied (\(x\)). The residual plot shows points randomly scattered in a horizontal band around zero, with no visible curve.
What does this residual plot suggest about the form of the relationship?
▶️ Answer / Explanation
Interpretation: The random scatter of residuals indicates that a linear association is appropriate. There is no systematic pattern suggesting curvature, so the linear model describes the form of the data well.
Example
A regression is run to predict fuel efficiency (mpg) from car engine size (liters). The residual plot shows a distinct U-shaped curve: residuals are negative for very small and very large engines, but positive for medium engines.
What does this pattern suggest about the form of association?
▶️ Answer / Explanation
Interpretation: The U-shape indicates that the true association is nonlinear. A simple linear model is not sufficient. A quadratic or curved regression model would better describe the form of association.