
2.9.A.1 Parameters of a Probability Distribution
A parameter is a numerical value that describes an entire population or probability distribution.
Unlike a statistic, which is calculated from a sample, a parameter describes the true characteristics of the population or the complete probability distribution.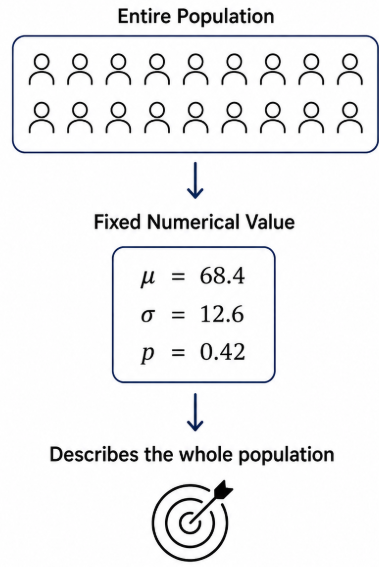
A parameter is a fixed value. Although we may not always know its value, it does not change unless the population or probability distribution changes.
Definition
A parameter is
A numerical measure that describes a characteristic of a population or a probability distribution.
Examples of parameters include:
- Population mean \(\mu\)
- Population standard deviation \(\sigma\)
- Population proportion \(p\)
- Expected value (mean) of a probability distribution \(E(X)\) or \(\mu_X\)
- Standard deviation of a probability distribution \(\sigma_X\)
Parameter vs. Statistic
| Parameter | Statistic |
|---|---|
| Describes a population or probability distribution. | Describes a sample. |
| Usually unknown but fixed. | Changes from sample to sample. |
| Examples: \(\mu,\ \sigma,\ p,\ E(X)\) | Examples: \(\bar{x},\ s,\ \hat{p}\) |
Example 1: Population Parameter
A school has 1,200 students. The average height of all students is 165 cm.
Since the average is calculated using every student in the population,
\( \mu =165\text{ cm} \)
is a parameter.
Example 2: Probability Distribution Parameter
A fair die is rolled once.
Let
\(X=\) Number rolled.
The expected value of this probability distribution is
\(E(X)=3.5\)
The value 3.5 describes the entire probability distribution, so it is a parameter.
Characteristics of Parameters
- Describe an entire population or probability distribution.
- Have one fixed numerical value.
- Usually unknown for populations but do not vary.
- Are commonly represented using Greek letters.
Important AP Exam Notes
- A parameter describes a population or an entire probability distribution.
- A parameter is a single fixed value.
- Parameters do not change from sample to sample.
- In Unit 2, the mean and standard deviation of a probability distribution are parameters.
- Do not confuse parameters with statistics.
Common AP Exam Mistakes
| Incorrect | Correct |
|---|---|
| Calling a sample mean a parameter. | A sample mean is a statistic. |
| Thinking parameters change with different samples. | Parameters are fixed values. |
| Confusing a probability distribution parameter with an observed outcome. | Parameters summarize the entire distribution, not one observation. |
Example
A probability distribution describes the number of customers entering a coffee shop each hour. The expected number of customers is 18.
Is the value 18 a parameter or a statistic? Explain.
▶️ Answer / Explanation
The value 18 is the expected value (mean) of the entire probability distribution.
Since it describes the complete probability distribution rather than a sample, it is a parameter.
Answer: 18 is a parameter.
2.9.A.2 Expected Value (Mean) of a Discrete Probability Distribution
The expected value, also called the mean, of a discrete probability distribution is the long-run average value of a random variable if the same random process is repeated many times.
The expected value is a parameter of the probability distribution and is denoted by
\(E(X)\) or \( \mu_X \)
Although the expected value may not be one of the possible values of the random variable, it represents the average outcome over many repetitions of the random process.
Formula for the Expected Value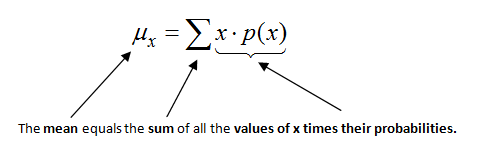
For a discrete random variable \(X\), the expected value is
\( \mu_X=E(X)=\sum x_i\cdot P(x_i) \)
Where:
- \(x_i\) = A possible value of the random variable.
- \(P(x_i)\) = Probability of the value \(x_i\).
- \(\sum\) means to add the products for all possible values.
How to Calculate the Expected Value
- List every possible value of the random variable.
- Multiply each value by its probability.
- Add all the products.
Example 1: Rolling a Fair Die
A fair six-sided die is rolled once.
Let
\(X=\) Number rolled.
| \(x_i\) | \(P(x_i)\) | \(x_iP(x_i)\) |
|---|---|---|
| 1 | \( \frac16 \) | \( \frac16 \) |
| 2 | \( \frac16 \) | \( \frac26 \) |
| 3 | \( \frac16 \) | \( \frac36 \) |
| 4 | \( \frac16 \) | \( \frac46 \) |
| 5 | \( \frac16 \) | \( \frac56 \) |
| 6 | \( \frac16 \) | \( \frac66 \) |
Calculation
\(E(X)=\frac16+\frac26+\frac36+\frac46+\frac56+\frac66=\frac{21}{6}=3.5\)
Interpretation
If a fair die is rolled many times, the average value of the rolls will approach 3.5.
Note: Even though 3.5 is not a possible outcome of a single die roll, it is the long-run average.
Example 2: Tossing Two Coins
Let
\(X=\) Number of Heads obtained.
| \(x_i\) | \(P(x_i)\) | \(x_iP(x_i)\) |
|---|---|---|
| 0 | 0.25 | 0 |
| 1 | 0.50 | 0.50 |
| 2 | 0.25 | 0.50 |
Calculation
\(E(X)=0+0.50+0.50=1\)
Interpretation
On average, about 1 Head is obtained every time two fair coins are tossed repeatedly.
Expected Value vs. Observed Value
| Expected Value | Observed Value |
|---|---|
| Long-run average over many repetitions. | Result of one trial. |
| May not be an actual possible outcome. | Must be one of the possible values. |
Important AP Exam Notes
- The expected value is the long-run average of the random variable.
- The expected value is calculated using
\(E(X)=\sum x_iP(x_i)\)
- The expected value is a parameter of the probability distribution.
- The expected value may not be one of the possible values of the random variable.
- Always interpret the expected value in the context of repeated random trials.
Common AP Exam Mistakes
| Incorrect | Correct |
|---|---|
| Adding the probabilities only. | Multiply each value by its probability first. |
| Assuming the expected value must be a possible outcome. | It represents the long-run average and may not be an actual outcome. |
| Interpreting the expected value as the result of one trial. | Interpret it as the average over many repetitions. |
Example
A discrete random variable \(X\) has the following probability distribution.
| \(X\) | \(P(X)\) |
|---|---|
| 0 | 0.30 |
| 1 | 0.50 |
| 2 | 0.20 |
Calculate and interpret the expected value.
▶️ Answer / Explanation
Step 1: Apply the expected value formula.
\(E(X)=0(0.30)+1(0.50)+2(0.20)\)
\(=0+0.50+0.40=0.90\)
Answer
The expected value is
\(E(X)=0.90\)
Interpretation: Over many repetitions of the random process, the average value of the random variable will be approximately 0.90.
2.9.A.3 Standard Deviation of a Discrete Probability Distribution
The standard deviation of a probability distribution measures the typical distance that the values of a random variable are from the expected value (mean).
It describes the variability or spread of the probability distribution.
The standard deviation of a discrete random variable is a parameter and is denoted by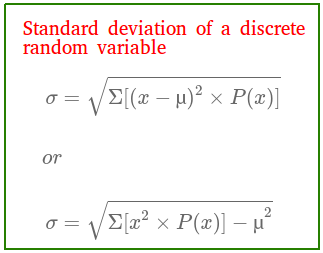
\(SD(X)\) or \( \sigma_X \)
Formula for Standard Deviation
For a discrete random variable \(X\), the standard deviation is
\( \sigma_X=\sqrt{\sum (x_i-\mu_X)^2\cdot P(x_i)} \)
Where:
- \(x_i\) = Possible value of the random variable.
- \(\mu_X=E(X)\) = Expected value (mean) of the probability distribution.
- \(P(x_i)\) = Probability of the value \(x_i\).
Variance
The quantity inside the square root is called the variance of the probability distribution.
The variance is denoted by
\(V(X)\) or \( \sigma_X^2 \)
The formula for variance is
\( \sigma_X^2=\sum (x_i-\mu_X)^2\cdot P(x_i) \)
The relationship between variance and standard deviation is
\( \sigma_X=\sqrt{\sigma_X^2} \)
How to Calculate the Standard Deviation
- Calculate the expected value \(E(X)\).
- Find the deviation from the mean for each value: \(x_i-\mu_X\)
- Square each deviation.
- Multiply each squared deviation by its probability.
- Add all of the products to obtain the variance.
- Take the square root of the variance.
Example
A discrete random variable \(X\) has the following probability distribution.
| \(X\) | \(P(X)\) |
|---|---|
| 0 | 0.25 |
| 1 | 0.50 |
| 2 | 0.25 |
Step 1: Calculate the mean.
\(E(X)=0(0.25)+1(0.50)+2(0.25)=1\)
Step 2: Calculate the variance.
| \(x_i\) | \(P(x_i)\) | \(x_i-\mu_X\) | \((x_i-\mu_X)^2\) | \((x_i-\mu_X)^2P(x_i)\) |
|---|---|---|---|---|
| 0 | 0.25 | −1 | 1 | 0.25 |
| 1 | 0.50 | 0 | 0 | 0 |
| 2 | 0.25 | 1 | 1 | 0.25 |
\( \sigma_X^2=0.25+0+0.25=0.50 \)
Step 3: Calculate the standard deviation.
\( \sigma_X=\sqrt{0.50}\approx0.707 \)
Interpretation
The standard deviation represents the typical distance between the values of the random variable and the expected value.
In this example, the values of \(X\) typically differ from the mean by about
\(0.707\) units.
Relationship Between Mean, Variance, and Standard Deviation
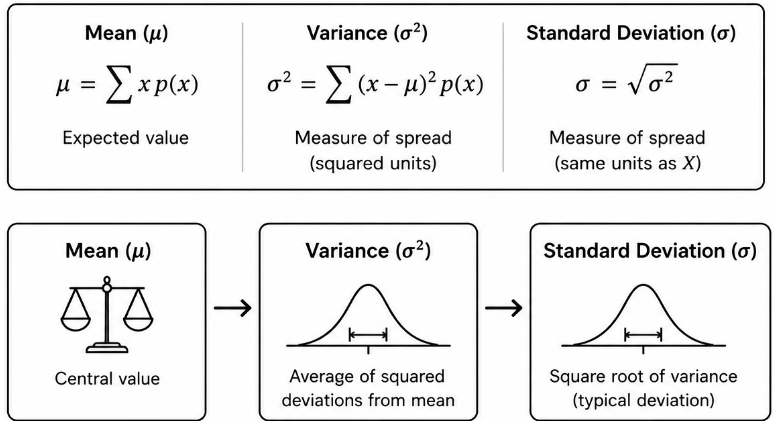
| Measure | Symbol | Purpose |
|---|---|---|
| Expected Value (Mean) | \(E(X)\) or \(\mu_X\) | Center of the probability distribution. |
| Variance | \(V(X)\) or \(\sigma_X^2\) | Measures the average squared distance from the mean. |
| Standard Deviation | \(SD(X)\) or \(\sigma_X\) | Measures the typical distance from the mean. |
Important AP Exam Notes
- The standard deviation measures the spread of a probability distribution.
- It describes the typical distance between the values of the random variable and the expected value.
- The variance is the square of the standard deviation.
- The standard deviation has the same units as the random variable.
- The variance has squared units.
- The AP Exam may provide technology output for the standard deviation, but you should understand what it represents and know the formula.
Common AP Exam Mistakes
| Incorrect | Correct |
|---|---|
| Using \(x_i\) instead of \(x_i-\mu_X\). | Subtract the mean before squaring. |
| Forgetting to multiply by the probabilities. | Multiply every squared deviation by its probability. |
| Stopping after finding the variance. | Take the square root to obtain the standard deviation. |
| Interpreting standard deviation as the average value. | It measures variability, not center. |
Example
A discrete random variable \(X\) has the following probability distribution.
| \(X\) | \(P(X)\) |
|---|---|
| 1 | 0.20 |
| 2 | 0.50 |
| 3 | 0.30 |
What does the standard deviation of this probability distribution represent?
▶️ Answer / Explanation
The standard deviation measures the typical distance between the values of the random variable and the expected value.
It describes how much the values of the probability distribution typically vary from the mean over many repetitions of the random process.
2.9.B.1 Interpreting the Mean and Standard Deviation of a Discrete Random Variable
After calculating the mean (expected value) and standard deviation of a discrete random variable, the final step is to interpret both values in the context of the problem.
On the AP Statistics Exam, your interpretation should always refer to the population and the random variable, not simply state the numerical values.
Interpreting the Mean
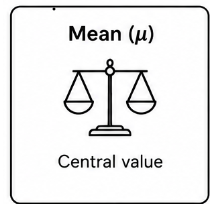
The mean, or expected value, represents the long-run average value of the random variable if the random process is repeated many times.
General Interpretation
“If the random process is repeated many times, the average value of the random variable is expected to be approximately \(\mu_X\).”
Important: The mean does not predict the result of a single trial. It describes the average over many repetitions.
Interpreting the Standard Deviation
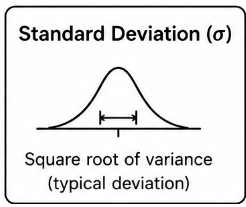
The standard deviation measures the typical distance between the values of the random variable and the mean.
General Interpretation
“The values of the random variable typically differ from the mean by about \(\sigma_X\) units.”
The standard deviation describes the variability or spread of the probability distribution.
Example 1: Number of Heads
A fair coin is tossed twice.
Let
\(X=\) Number of Heads obtained.
Suppose
\(E(X)=1\)
\(\sigma_X\approx0.71\)
Interpretation of the Mean
If two fair coins are tossed repeatedly, the average number of Heads obtained per trial will be approximately 1 Head.
Interpretation of the Standard Deviation
The number of Heads obtained typically differs from the average of 1 Head by about 0.71 Heads.
Example 2: Customers Entering a Store
Let
\(X=\) Number of customers entering a store during one hour.
Suppose
\(E(X)=18\)
\(\sigma_X=3.5\)
Interpretation of the Mean
If this process is observed over many hours, the average number of customers entering the store per hour is expected to be about 18 customers.
Interpretation of the Standard Deviation
The number of customers entering the store during one hour typically differs from the average of 18 customers by about 3.5 customers.
Writing Interpretations on the AP Exam
| Statistic | How to Interpret |
|---|---|
| Mean (Expected Value) | Describe the long-run average value of the random variable. |
| Standard Deviation | Describe the typical distance of the values from the mean. |
Important AP Exam Notes
- Always interpret the mean and standard deviation in the context of the problem.
- The mean represents the long-run average, not the outcome of a single trial.
- The standard deviation measures the typical distance from the mean, not the maximum or minimum distance.
- Include the units of the random variable in your interpretation.
- Reference the population or the random process described in the problem.
Common AP Exam Mistakes
| Incorrect | Correct |
|---|---|
| “The mean is 18.” | Interpret it as the long-run average in context. |
| “The standard deviation is 3.5.” | Interpret it as the typical distance from the mean in context. |
| Predicting a single future outcome using the expected value. | Expected value describes the average over many repetitions. |
| Forgetting to mention the random variable or population. | Always interpret using the context of the problem. |
Example
A probability distribution models the number of defective batteries in a shipment.
Suppose
\(E(X)=4.2\)
\(\sigma_X=1.3\)
Interpret both the mean and the standard deviation.
▶️ Answer / Explanation
Mean:
If many shipments are observed, the average number of defective batteries per shipment is expected to be approximately 4.2 batteries.
Standard Deviation:
The number of defective batteries in a shipment typically differs from the average of 4.2 batteries by about 1.3 batteries.