
3.1.A.1 Unbiased Estimators
When using a sample statistic to estimate a population parameter, the statistic is called an estimator.
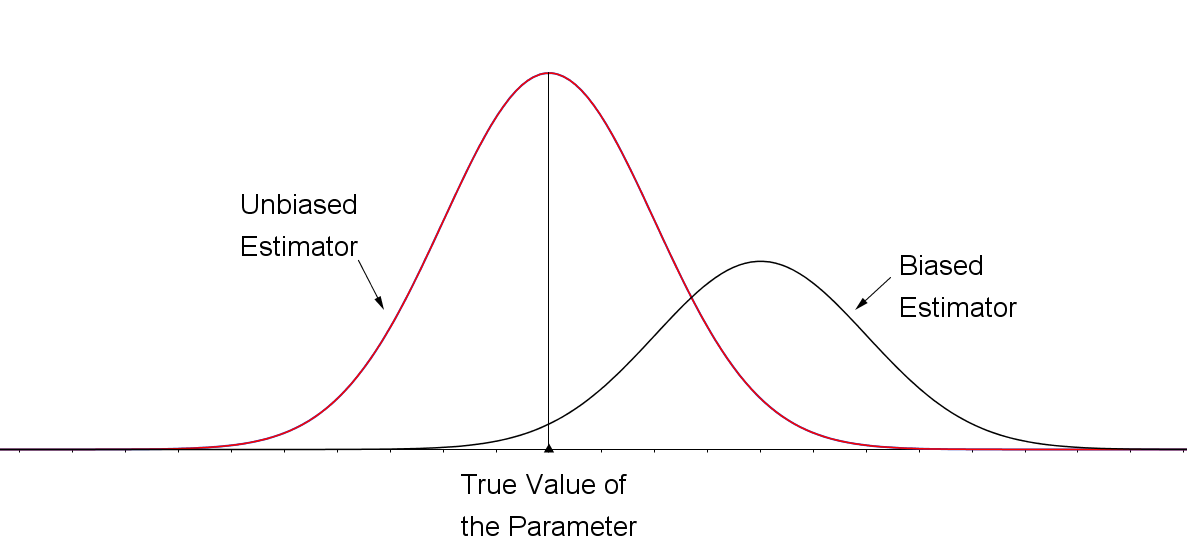
An estimator is unbiased if, over many random samples of the same size, the estimator does not systematically overestimate or underestimate the true population parameter.
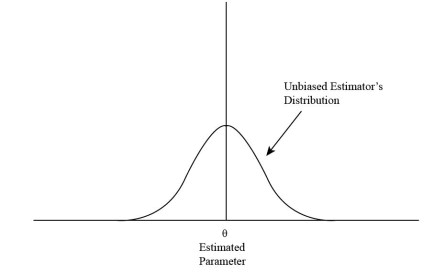
In other words, if the sampling process were repeated many times, the average value of the estimator would equal the actual population parameter.
An estimator is biased if it consistently produces estimates that are either too high or too low compared to the true population parameter.
Key Terms
| Term | Definition |
|---|---|
| Estimator | A sample statistic used to estimate a population parameter. |
| Unbiased Estimator | An estimator whose average value from many random samples equals the true population parameter. |
| Biased Estimator | An estimator that consistently overestimates or underestimates the population parameter. |
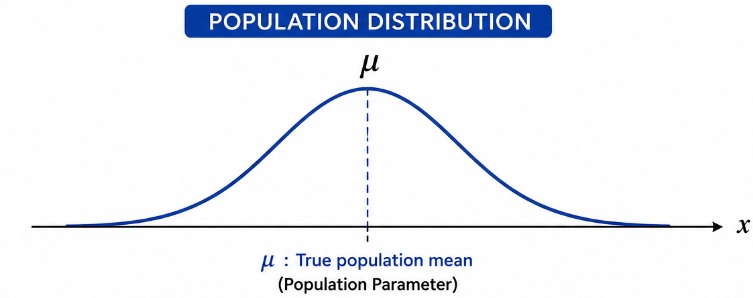
| Population Parameter | The true numerical value describing a population. |
| Estimator Type | Average of Many Sample Estimates | Conclusion |
|---|---|---|
| Unbiased | Equals the true population parameter | No systematic error |
| Biased | Consistently above or below the true parameter | Systematic overestimation or underestimation |
Example 1: Unbiased Estimator
A researcher repeatedly takes random samples of 50 students to estimate the average number of hours students study each week.
- The true population mean is 12 hours.
- The sample means from many random samples average to 12 hours.
Conclusion: The sample mean is an unbiased estimator because, on average, it equals the true population mean.
Example 2: Biased Estimator
A survey estimates the average amount of sleep by collecting responses only from students enrolled in early-morning classes.
- The resulting estimates consistently average less than the true population average.
Conclusion: This estimator is biased because it systematically underestimates the population parameter.
Important AP Exam Notes
- An estimator is unbiased if its average value from many random samples equals the true population parameter.
- Individual sample estimates do not have to equal the population parameter.
- Unbiased does not mean every estimate is correct.
- Sampling variability still exists, even for unbiased estimators.
- The sample mean \(\bar{x}\) is an unbiased estimator of the population mean \(\mu\).
Common AP Exam Mistakes
| Incorrect | Correct |
|---|---|
| An unbiased estimator always equals the true parameter. | Only the average of many estimates equals the true parameter. |
| A single estimate above the parameter means the estimator is biased. | Bias is determined by the long-run average over many samples. |
| Unbiased means there is no variability. | An unbiased estimator can still produce different values from sample to sample. |
Example
A statistician repeatedly takes simple random samples from the same population to estimate the population mean.
The average of all the sample means is equal to the true population mean, although individual sample means vary.
Determine whether the sample mean is an unbiased estimator. Justify your answer.
▶️ Answer / Explanation
Answer:
The sample mean is an unbiased estimator.
Explanation:
An estimator is unbiased if its average value over many random samples equals the true population parameter.
Although the individual sample means vary because of sampling variability, their average equals the population mean.
Therefore, the estimator does not systematically overestimate or underestimate the true parameter.
3.1.B.1 Point Estimates for Population Parameters
In statistics, it is usually impossible or impractical to collect data from an entire population. Instead, statisticians collect a random sample and use a sample statistic to estimate the corresponding population parameter.
A sample statistic used to estimate a population parameter is called a point estimator.
A point estimate is the actual numerical value of the sample statistic obtained from a sample. It represents the best single estimate of the unknown population parameter.
For example,
- The sample proportion \( \hat{p} \) is the point estimator for the population proportion \( p \).
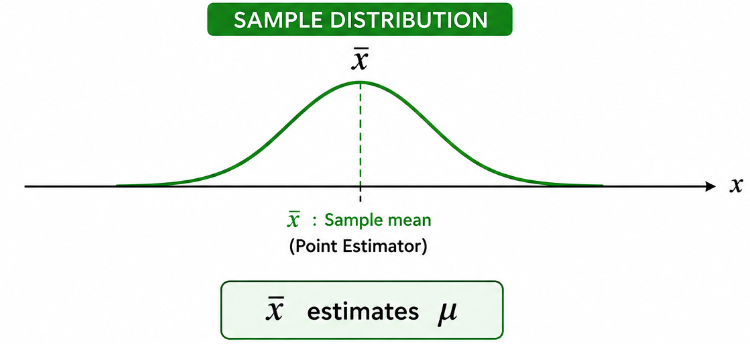
- Similarly, the sample mean \( \bar{x} \) is the point estimator for the population mean \( \mu \).
| Term | Definition |
|---|---|
| Population Parameter | A numerical value that describes an entire population. |
| Sample Statistic | A numerical value calculated from a sample. |
| Point Estimator | A sample statistic used to estimate a population parameter. |
| Point Estimate | The actual numerical value of the sample statistic obtained from a sample. |
Common Point Estimators
| Population Parameter | Point Estimator | Point Estimate |
|---|---|---|
Population Mean \( \mu \) | Sample Mean \( \bar{x} \) | Calculated value of \( \bar{x} \) |
Population Proportion \( p \) | Sample Proportion \( \hat{p} \) | Calculated value of \( \hat{p} \) |
Formula for Sample Proportion
\( \hat{p}=\dfrac{x}{n} \)
Where:
- \( \hat{p} \) = Sample proportion (point estimator)
- \( x \) = Number of individuals in the sample with the characteristic of interest (successes)
- \( n \) = Sample size
Example 1: Estimating a Population Proportion
A random sample of 250 registered voters is selected.
Of those sampled, 165 say they support a proposed law.
Step 1: Identify the point estimator.
\( \hat{p}=\dfrac{x}{n} \)
Step 2: Substitute the values.
\( \hat{p}=\dfrac{165}{250}=0.66 \)
Conclusion:
The point estimate of the population proportion is 0.66.
Example 2: Estimating a Population Mean
A random sample of 20 students has an average study time of 7.4 hours per week.
The sample mean is
\( \bar{x}=7.4 \)
Conclusion:
The point estimate for the population mean is 7.4 hours.
Important AP Exam Notes
- A sample statistic is used as a point estimator for a population parameter.
- A point estimate is the numerical value calculated from the sample.
- \( \hat{p} \) estimates the population proportion \( p \).
- \( \bar{x} \) estimates the population mean \( \mu \).
- Point estimates are based on sample data and usually differ from the true population parameter because of sampling variability.
Common AP Exam Mistakes
| Incorrect | Correct |
|---|---|
| Confusing a population parameter with a sample statistic. | A sample statistic estimates a population parameter. |
| Thinking a point estimate equals the true population value. | A point estimate is only an estimate and may differ from the true parameter. |
| Using \( p \) instead of \( \hat{p} \) for a sample proportion. | Use \( \hat{p} \) for sample proportion and \( p \) for population proportion. |
Example
A random sample of 400 high school students is selected to estimate the proportion of students who participate in at least one school club.
Among the students sampled, 292 participate in a school club.
Calculate the point estimate of the population proportion and identify the population parameter being estimated.
▶️ Answer / Explanation
Step 1: Identify the point estimator.
\( \hat{p}=\dfrac{x}{n} \)
Step 2: Substitute the sample values.
\( \hat{p}=\dfrac{292}{400}=0.73 \)
Answer
The point estimate of the population proportion is
\( \hat{p}=0.73 \)
The population parameter being estimated is the population proportion \( p \) of all high school students who participate in at least one school club.