
3.10.A Identifying an Appropriate Confidence Interval Procedure for the Difference Between Two Population Proportions
When comparing two population proportions, a confidence interval can be constructed to estimate the difference between the true population proportions.
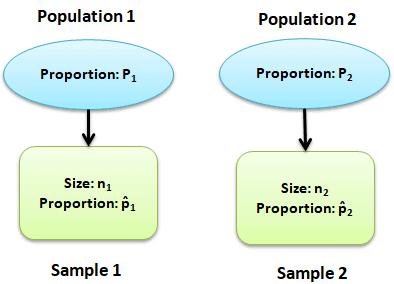
The appropriate confidence interval procedure depends on the type of data being collected.
For two independent random samples with categorical data, the appropriate procedure is a two-sample z-interval for the difference between two population proportions.
3.10.A.1 Appropriate Confidence Interval Procedure
Based on the sample data, a confidence interval can be calculated to estimate
\(p_1-p_2\)
where:
- \(p_1\) = Population proportion for Population 1
- \(p_2\) = Population proportion for Population 2
The correct inference procedure is:
Two-Sample z-Interval for the Difference Between Two Population Proportions
This interval estimates the difference between the two population proportions using information from two independent random samples.
When Is This Procedure Used?
Use a two-sample z-interval when:
- The response variable is categorical.
- There are two independent populations or treatment groups.
- The goal is to estimate the difference between two population proportions.
Examples
| Situation | Appropriate Procedure |
|---|---|
| Compare the proportion of voters supporting two candidates. | Two-sample z-interval. |
| Compare the proportion of defective products from two factories. | Two-sample z-interval. |
| Compare the proportion of students who passed an exam at two schools. | Two-sample z-interval. |
3.10.A.2 Parameter for the Confidence Interval
The parameter of interest is the difference between the two population proportions.
A complete parameter statement should identify:
- The population parameter.
- The response variable.
- The two populations being compared.
General Parameter
\(\boxed{p_1-p_2}\)
Example Parameter Statement
“The parameter is the difference between the true proportion of students who pass the AP Statistics exam at School A and the true proportion of students who pass the AP Statistics exam at School B.”
Example
A researcher wants to compare the proportion of adults who exercise at least three times per week in two different cities.
Appropriate Procedure
Use a two-sample z-interval for the difference between two population proportions.
Parameter
The difference between the true proportion of adults who exercise regularly in City 1 and the true proportion of adults who exercise regularly in City 2.
Important AP Exam Notes
- Use a two-sample z-interval when estimating the difference between two population proportions.
- The response variable must be categorical.
- The parameter is always the difference between the two population proportions, \(p_1-p_2\).
- A complete parameter statement should include the response variable and identify both populations in context.
- Keep the order of the populations consistent throughout the confidence interval and interpretation.
Common AP Exam Mistakes
| Incorrect | Correct |
|---|---|
| Using a two-sample t-interval. | Use a two-sample z-interval for proportions. |
| Describing the parameter as the difference between sample proportions. | The parameter is the difference between the population proportions. |
| Ignoring the study context. | Always identify the response variable and both populations. |
Example
A researcher wants to estimate the difference between the proportion of registered voters who support a proposed law in City A and the proportion who support the law in City B.
Identify the appropriate confidence interval procedure and state the parameter in context.
▶️ Answer / Explanation
Confidence Interval Procedure:
Use a two-sample z-interval for the difference between two population proportions.
Parameter:
The difference between the true proportion of registered voters who support the proposed law in City A and the true proportion of registered voters who support the proposed law in City B.
3.10.B.1 Conditions for Constructing a Two-Sample z-Interval for the Difference Between Two Population Proportions
Before constructing a two-sample z-interval for the difference between two population proportions, three conditions must be verified.
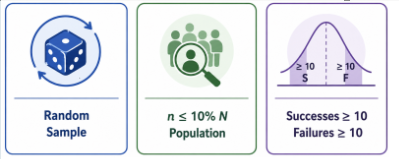
These conditions ensure that the confidence interval procedure is appropriate and that the sampling distribution of the difference in sample proportions can be modeled using a normal distribution.
Condition 1: Randomization Condition
The data should be collected using either:
- Two independent random samples, or
- A randomized experiment in which treatments are randomly assigned.
This condition ensures that the observations are independent and that the samples are representative of the populations or treatment groups.
Condition 2: 10% Condition
If sampling is performed without replacement, each sample size must be no more than 10% of its respective population.
\(\boxed{n_1\le0.10N_1 \quad\text{and}\quad n_2\le0.10N_2}\)
Where:
- \(n_1\) = Sample size from Population 1
- \(N_1\) = Population size for Population 1
- \(n_2\) = Sample size from Population 2
- \(N_2\) = Population size for Population 2
Note: This condition is not required when the data come from a randomized experiment.
Condition 3: Normality (Large Counts) Condition
Each sample must contain at least 10 observed successes and 10 observed failures.
Use the sample proportions to verify this condition.
All four quantities must be at least 10:
- \(\boxed{n_1\hat{p}_1\ge10}\)
- \(\boxed{n_1(1-\hat{p}_1)\ge10}\)
- \(\boxed{n_2\hat{p}_2\ge10}\)
- \(\boxed{n_2(1-\hat{p}_2)\ge10}\)
Where:
- \(\hat{p}_1\) = Sample proportion from Sample 1
- \(\hat{p}_2\) = Sample proportion from Sample 2
If all four values are at least 10, the normal approximation is appropriate.
Example
A researcher compares the proportion of students who own a laptop at two universities.
- University A: \(n_1=150,\;\hat{p}_1=0.72\)
- University B: \(n_2=180,\;\hat{p}_2=0.65\)
Step 1: Randomization
The problem states that two independent random samples were selected.
✔ Condition satisfied.
Step 2: 10% Condition
Each sample is less than 10% of its respective population.
✔ Condition satisfied.
Step 3: Large Counts
\(150(0.72)=108\)
\(150(0.28)=42\)
\(180(0.65)=117\)
\(180(0.35)=63\)
All four values are at least 10.
✔ The normality condition is satisfied.
Therefore, a two-sample z-interval is appropriate.
Important AP Exam Notes
- Always verify all three conditions before constructing a two-sample z-interval.
- For the confidence interval, use the sample proportions (\(\hat{p}_1\) and \(\hat{p}_2\)) to check the Large Counts Condition.
- The 10% condition is unnecessary for randomized experiments.
- All four observed counts (successes and failures) must be at least 10.
- Keep the order of the populations consistent throughout the confidence interval.
Common AP Exam Mistakes
| Incorrect | Correct |
|---|---|
| Using population proportions to check the normality condition. | Use the sample proportions \(\hat{p}_1\) and \(\hat{p}_2\). |
| Checking only the number of successes. | Check both observed successes and observed failures for both samples. |
| Applying the 10% condition to randomized experiments. | The 10% condition is only needed when sampling without replacement. |
Example
A survey compares the proportion of adults who recycle in two cities.
The samples are:
- City A: \(n_1=120,\;\hat{p}_1=0.55\)
- City B: \(n_2=150,\;\hat{p}_2=0.48\)
Determine whether a two-sample z-interval for the difference between the population proportions is appropriate.
▶️ Answer / Explanation
Randomization: Two independent random samples were selected. ✔
10% Condition: Each sample is less than 10% of its respective population. ✔
Large Counts:
\(120(0.55)=66\)
\(120(0.45)=54\)
\(150(0.48)=72\)
\(150(0.52)=78\)
All four values are at least 10. ✔
Therefore, all required conditions are satisfied, and a two-sample z-interval is appropriate.
3.10.C Calculating a Confidence Interval for the Difference Between Two Population Proportions
A confidence interval estimates the difference between two population proportions using information from two independent random samples.
The interval provides a range of plausible values for the true difference between the population proportions.
3.10.C.1 Point Estimate
The point estimate for the difference between two population proportions is the difference between the two sample proportions.
\(\boxed{\hat{p}_1-\hat{p}_2}\)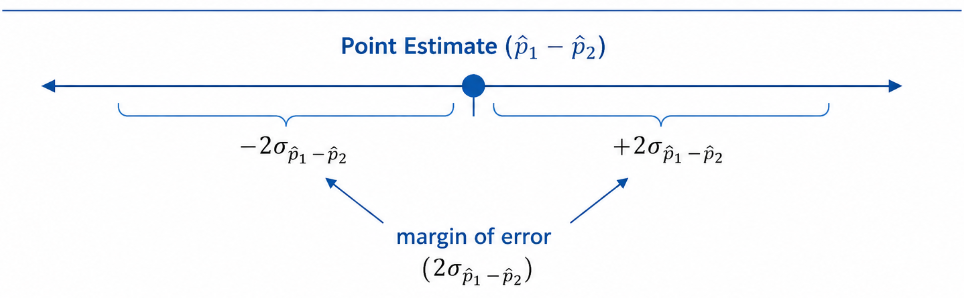
Where:
- \(\hat{p}_1\) = Sample proportion from Population 1
- \(\hat{p}_2\) = Sample proportion from Population 2
The point estimate is the single best estimate of the true difference
\(p_1-p_2\)
3.10.C.2 Confidence Interval Formula
A confidence interval is calculated as
Point Estimate ± Margin of Error
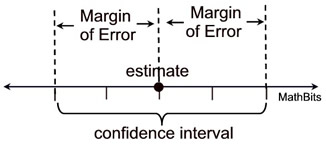
For two population proportions, the confidence interval is
\(\boxed{(\hat{p}_1-\hat{p}_2)\pm z^*\sqrt{\dfrac{\hat{p}_1(1-\hat{p}_1)}{n_1}+\dfrac{\hat{p}_2(1-\hat{p}_2)}{n_2}}}\)
Point Estimate
\(\hat{p}_1-\hat{p}_2\)
Standard Error
\(SE=\sqrt{\dfrac{\hat{p}_1(1-\hat{p}_1)}{n_1}+\dfrac{\hat{p}_2(1-\hat{p}_2)}{n_2}}\)
Margin of Error
\(ME=z^*\times SE\)
Confidence Interval
\((\hat{p}_1-\hat{p}_2)\pm ME\)
Meaning of the Symbols
| Symbol | Meaning |
|---|---|
| \(\hat{p}_1\) | Sample proportion from Population 1 |
| \(\hat{p}_2\) | Sample proportion from Population 2 |
| \(n_1\) | Sample size from Population 1 |
| \(n_2\) | Sample size from Population 2 |
| \(z^*\) | Critical value for the selected confidence level |
Step-by-Step Procedure
- Calculate each sample proportion:
\(\hat{p}=\dfrac{x}{n}\)
- Find the point estimate:
\(\hat{p}_1-\hat{p}_2\)
- Calculate the standard error.
- Find the critical value \(z^*\).
- Compute the margin of error:
\(ME=z^*\times SE\)
- Construct the confidence interval:
Point Estimate ± Margin of Error
Example
A survey compares the proportion of students who own a laptop at two universities.
- University A: \(n_1=200,\;x_1=150\)
- University B: \(n_2=180,\;x_2=117\)
Step 1: Calculate the sample proportions.
\(\hat{p}_1=\dfrac{150}{200}=0.75\)
\(\hat{p}_2=\dfrac{117}{180}=0.65\)
Step 2: Point estimate.
\(0.75-0.65=0.10\)
Step 3: Standard error.
\(SE=\sqrt{\dfrac{0.75(0.25)}{200}+\dfrac{0.65(0.35)}{180}}\approx0.046\)
Step 4: Margin of error (95% confidence).
\(ME=1.96(0.046)\approx0.090\)
Step 5: Confidence interval.
\(0.10\pm0.090\)
\((0.010,\;0.190)\)
Important AP Exam Notes
- The point estimate is the difference between the sample proportions.
- The confidence interval estimates the difference between the population proportions.
- Use the sample proportions in the standard error formula.
- The critical value \(z^*\) depends on the chosen confidence level.
- Keep the order of subtraction consistent throughout the calculation and interpretation.
Common AP Exam Mistakes
| Incorrect | Correct |
|---|---|
| Using a t-critical value. | Use a z-critical value. |
| Using population proportions in the standard error formula. | Use the sample proportions. |
| Changing the subtraction order midway through the problem. | Maintain the same order throughout. |
Example
A survey compares recycling rates in two cities.
- City A: 180 of 250 residents recycle.
- City B: 126 of 210 residents recycle.
Calculate the point estimate for the difference between the population proportions and write the formula for the confidence interval.
▶️ Answer / Explanation
Sample Proportions
\(\hat{p}_1=\dfrac{180}{250}=0.72\)
\(\hat{p}_2=\dfrac{126}{210}=0.60\)
Point Estimate
\(\hat{p}_1-\hat{p}_2=0.72-0.60=0.12\)
Confidence Interval Formula
\(0.12\pm z^*\sqrt{\dfrac{0.72(0.28)}{250}+\dfrac{0.60(0.40)}{210}}\)
3.10.D Calculating the Standard Error and Margin of Error for the Difference Between Two Population Proportions
When constructing a two-sample z-interval for the difference between two population proportions, two important quantities must be calculated:
- Standard Error (SE), which measures the variability of the point estimate.
- Margin of Error (ME), which determines how far the confidence interval extends on either side of the point estimate.
3.10.D.1 Standard Error
The standard error (SE) measures the expected variability in the difference between two sample proportions from one random sample to another.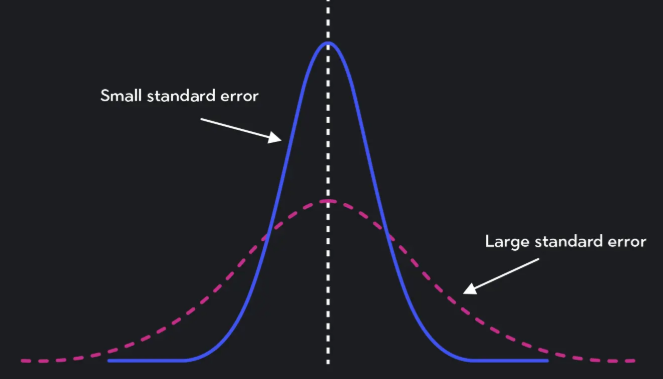
The formula is
\(\boxed{SE_{\hat{p}_1-\hat{p}_2}=\sqrt{\dfrac{\hat{p}_1(1-\hat{p}_1)}{n_1}+\dfrac{\hat{p}_2(1-\hat{p}_2)}{n_2}}}\)
Standard Error
\(\boxed{SE=\sqrt{\dfrac{\hat{p}_1(1-\hat{p}_1)}{n_1}+\dfrac{\hat{p}_2(1-\hat{p}_2)}{n_2}}}\)
Where:
- \(\hat{p}_1\) = Sample proportion from Population 1
- \(\hat{p}_2\) = Sample proportion from Population 2
- \(n_1\) = Sample size from Population 1
- \(n_2\) = Sample size from Population 2
Interpretation of the Standard Error
The standard error represents the typical amount by which the difference between two sample proportions varies from one pair of random samples to another.
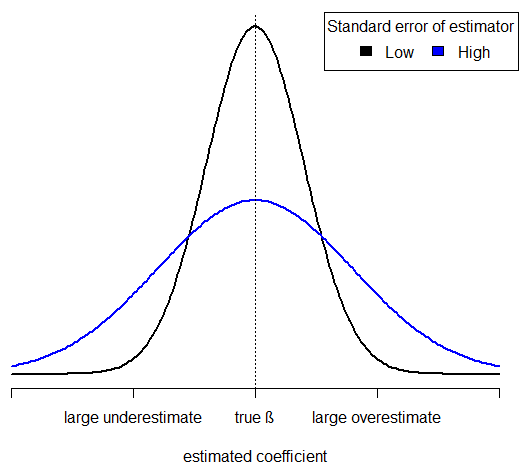
- A smaller SE means the estimate is more precise.
- A larger SE means there is greater sampling variability.
3.10.D.2 Margin of Error
The margin of error (ME) determines how far the confidence interval extends on either side of the point estimate.
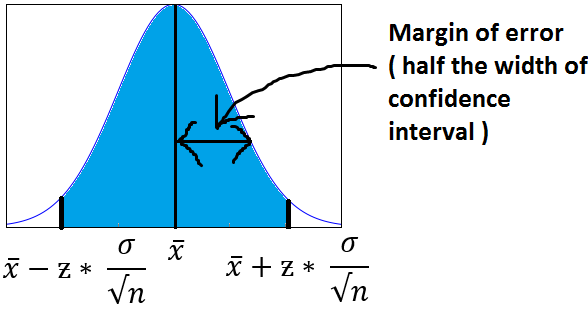
The margin of error equals the critical value multiplied by the standard error.
\(\boxed{ME=z^*\times SE}\)
Substituting the formula for the standard error gives
\(\boxed{ME=z^*\sqrt{\dfrac{\hat{p}_1(1-\hat{p}_1)}{n_1}+\dfrac{\hat{p}_2(1-\hat{p}_2)}{n_2}}}\)
Common Critical Values
| Confidence Level | Critical Value (\(z^*\)) |
|---|---|
| 90% | 1.645 |
| 95% | 1.96 |
| 99% | 2.576 |
Step-by-Step Example
A survey compares the proportion of students who own a laptop at two universities.
- University A: \(n_1=200,\;\hat{p}_1=0.75\)
- University B: \(n_2=180,\;\hat{p}_2=0.65\)
Step 1: Calculate the Standard Error
\(SE=\sqrt{\dfrac{0.75(0.25)}{200}+\dfrac{0.65(0.35)}{180}}\)
\(=\sqrt{0.0009375+0.0012639}\)
\(=\sqrt{0.0022014}\approx0.0469\)
Step 2: Calculate the Margin of Error (95% Confidence)
\(ME=1.96(0.0469)\approx0.092\)
The confidence interval would extend approximately 0.092 above and below the point estimate.
Effect of Sample Size
| If… | Effect on SE | Effect on ME |
|---|---|---|
| Sample sizes increase | Decreases | Decreases |
| Sample sizes decrease | Increases | Increases |
Larger samples produce more precise confidence intervals because they reduce both the standard error and the margin of error.
Important AP Exam Notes
- Use the sample proportions (\(\hat{p}_1\) and \(\hat{p}_2\)) when calculating the standard error.
- The margin of error equals the critical value multiplied by the standard error.
- Larger sample sizes produce smaller standard errors and narrower confidence intervals.
- The critical value depends on the selected confidence level.
- Maintain the same subtraction order throughout the entire problem.
Common AP Exam Mistakes
| Incorrect | Correct |
|---|---|
| Using a t-critical value. | Use the appropriate z-critical value. |
| Using population proportions in the SE formula. | Use the sample proportions. |
| Thinking the margin of error is the same as the standard error. | Margin of error = critical value × standard error. |
Example
A survey compares the proportion of customers who prefer two different smartphone brands.
- Brand A: \(n_1=250,\;\hat{p}_1=0.68\)
- Brand B: \(n_2=220,\;\hat{p}_2=0.59\)
Calculate the standard error and the margin of error for a 95% confidence interval.
▶️ Answer / Explanation
Standard Error
\(SE=\sqrt{\dfrac{0.68(0.32)}{250}+\dfrac{0.59(0.41)}{220}}\)
\(=\sqrt{0.0008704+0.0010995}\)
\(=\sqrt{0.0019699}\approx0.0444\)
Margin of Error
\(ME=1.96(0.0444)\approx0.087\)
Answer:
- Standard Error ≈ 0.044
- Margin of Error ≈ 0.087