
3.11.A Interpreting a Confidence Interval for the Difference Between Two Population Proportions
A confidence interval provides a range of plausible values for the true difference between two population proportions.
Because the interval is calculated from sample data, it may or may not contain the actual difference between the two population proportions.
3.11.A.1 The Confidence Interval May or May Not Contain the True Parameter
A confidence interval is based on information from two independent samples, not the entire populations.
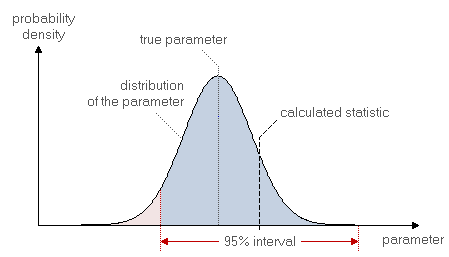
Therefore, each confidence interval is only an estimate of the true difference between the population proportions.
As a result:
- Some confidence intervals will contain the true difference.
- Some confidence intervals will not contain the true difference.
The actual difference between the two population proportions is a fixed value, but the confidence interval changes from sample to sample.
3.11.A.2 Interpreting the Confidence Level
A confidence level describes the long-run success rate of the confidence interval procedure.
Interpretation
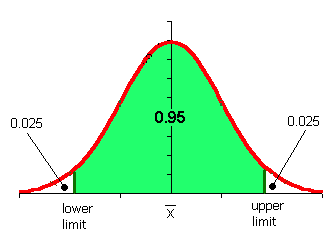
In repeated random sampling using the same sample sizes from the same two populations, approximately \(C\%\) of the confidence intervals constructed will capture the true difference between the two population proportions.
Here, \(C\) represents the numerical confidence level (such as 90%, 95%, or 99%).
Example
Suppose a researcher repeatedly constructs 95% confidence intervals for the difference between two population proportions.
Interpretation
Approximately 95% of those intervals will contain the true difference between the two population proportions, while about 5% will fail to capture the true difference.
3.11.A.3 Interpreting a Specific Confidence Interval
Suppose a \(C\%\) confidence interval for the difference between two population proportions is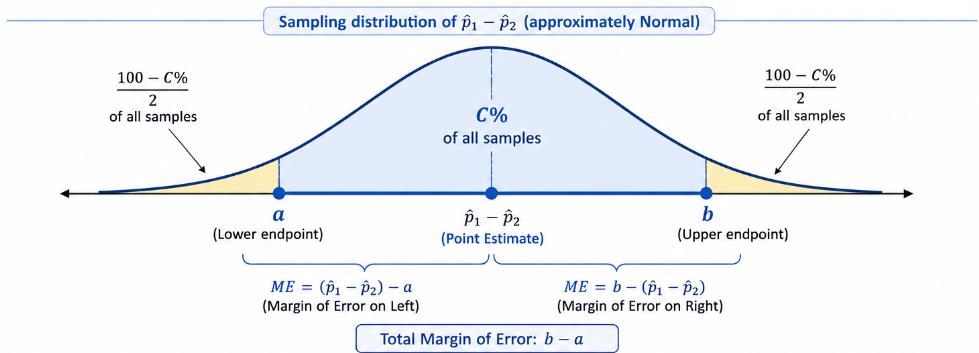
\((a,\;b)\)
where
- \(a\) = Lower endpoint
- \(b\) = Upper endpoint
Correct Interpretation
We are \(C\%\) confident that the interval \((a,\;b)\) contains the true difference between the two population proportions, \(p_1-p_2\), for the two populations described in the study.
The interpretation should always identify:
- The confidence level.
- The parameter (\(p_1-p_2\)).
- The response variable.
- The two populations in context.
Example
A survey compares the proportion of adults who recycle in City A and City B.
A 95% confidence interval for
\(p_A-p_B\)
is
\((0.05,\;0.14)\)
Interpretation
We are 95% confident that the true difference between the proportion of adults who recycle in City A and the proportion of adults who recycle in City B is between 0.05 and 0.14.
This means the proportion of adults who recycle in City A is estimated to be between 5 and 14 percentage points higher than the proportion in City B.
Important AP Exam Notes
- A confidence interval estimates the difference between the population proportions, not the sample proportions.
- The confidence level describes the long-run success rate of the method.
- Never state that there is a \(C\%\) probability that the parameter is in the interval after the interval has been calculated.
- Always interpret the interval using the specific populations and response variable given in the problem.
- Maintain the same subtraction order (\(p_1-p_2\)) throughout the interpretation.
Common AP Exam Mistakes
| Incorrect | Correct |
|---|---|
| There is a 95% probability that the true difference is in this interval. | We are 95% confident that the interval contains the true difference. |
| The confidence interval contains the sample proportions. | The confidence interval estimates the difference between the population proportions. |
| Ignoring the study context. | Always describe the two populations and the response variable. |
Example
A researcher compares the proportion of households that own electric vehicles in two cities.
A 95% confidence interval for
\(p_1-p_2\)
is
\((0.03,\;0.11)\)
Interpret this confidence interval in context.
▶️ Answer / Explanation
We are 95% confident that the true difference between the proportion of households that own electric vehicles in City 1 and the proportion of households that own electric vehicles in City 2 is between 0.03 and 0.11.
This means the proportion of households that own electric vehicles in City 1 is estimated to be between 3 and 11 percentage points higher than the proportion in City 2.
3.11.B.1 Justifying a Claim Using a Confidence Interval for the Difference Between Two Population Proportions
A confidence interval for the difference between two population proportions can be used to determine whether there is convincing statistical evidence to support a claim about the difference between the populations.
The key value to examine is \(0\) because a difference of 0 means the two population proportions are equal.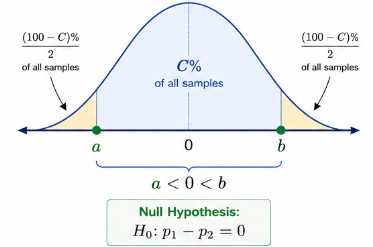
Key Idea
The confidence interval estimates the parameter
\(p_1-p_2\)
- If the interval contains 0, then a difference of zero is a plausible value for the true parameter.
- If the interval does not contain 0, then a difference of zero is not a plausible value.
Decision Rule
| Confidence Interval | Conclusion |
|---|---|
| Contains 0 | There is insufficient evidence to conclude that the two population proportions are different. |
| Does not contain 0 | There is sufficient evidence to conclude that the two population proportions are different. |
Why Does 0 Matter?
The parameter being estimated is
\(p_1-p_2\)
If
\(p_1-p_2=0\)
then
\(p_1=p_2\)
which means there is no difference between the two population proportions.
Therefore, checking whether the confidence interval contains 0 tells us whether “no difference” is a plausible value.
Example 1: Interval Does Not Contain 0
A 95% confidence interval for
\(p_1-p_2\)
is
\((0.06,\;0.18)\)
Since the interval does not contain 0, there is sufficient evidence to conclude that the two population proportions are different.
The entire interval is positive, suggesting that Population 1 has a higher population proportion than Population 2.
Example 2: Interval Contains 0
A 95% confidence interval for
\(p_1-p_2\)
is
\((-0.04,\;0.09)\)
Since the interval contains 0, there is insufficient evidence to conclude that the two population proportions are different.
A difference of zero remains a plausible value for the true difference.
| Confidence Interval | Contains 0? | Decision |
|---|---|---|
| \((0.04,\;0.15)\) | No | Evidence of a difference. |
| \((-0.08,\;0.03)\) | Yes | No convincing evidence of a difference. |
| \((-0.20,\;-0.06)\) | No | Evidence of a difference. |
Important AP Exam Notes
- The parameter being estimated is \(p_1-p_2\).
- A confidence interval that contains 0 indicates insufficient evidence of a difference between the two population proportions.
- A confidence interval that does not contain 0 indicates sufficient evidence of a difference.
- Always state conclusions in the context of the populations being studied.
- Use cautious statistical language such as “there is sufficient evidence” or “there is insufficient evidence”.
Common AP Exam Mistakes
| Incorrect | Correct |
|---|---|
| If the interval contains 0, the population proportions are equal. | If the interval contains 0, there is insufficient evidence to conclude they differ. |
| Ignoring the value 0. | Always check whether 0 is inside the interval. |
| Making conclusions without referring to the populations. | State conclusions in the context of the study. |
Example
A researcher constructs a 95% confidence interval for the difference between the proportion of homeowners who support a recycling program in City A and City B.
The confidence interval is
\((0.02,\;0.11)\)
Use the confidence interval to justify whether there is evidence of a difference between the two population proportions.
▶️ Answer / Explanation
The interval does not contain 0.
Therefore, there is sufficient evidence to conclude that the true proportion of homeowners who support the recycling program differs between City A and City B.
Because the entire interval is positive, the true proportion is estimated to be higher in City A than in City B.