
3.12.A.1 Identifying the Appropriate Hypothesis Test for the Difference Between Two Population Proportions
When the goal is to compare the proportions of two independent populations, a hypothesis test is used to determine whether there is convincing statistical evidence that the two population proportions differ.
The appropriate inference procedure is a two-sample z-test for the difference between two population proportions.
This test compares the sample proportions from two independent random samples to determine whether the observed difference is statistically significant or could reasonably be explained by random sampling variation.
Appropriate Hypothesis Testing Procedure
| Situation | Appropriate Procedure |
|---|---|
| Compare two independent population proportions | Two-Sample z-Test for the Difference Between Two Population Proportions |
When Is This Procedure Used?
- To compare the proportions from two independent populations.
- When data are collected from independent random samples or randomized experiments.
- When the required conditions for a two-sample z-test are satisfied.
Example 1
A researcher wants to determine whether the proportion of students who pass an AP Statistics exam differs between School A and School B.
Independent random samples are selected from both schools.
Appropriate Procedure:
Two-Sample z-Test for the Difference Between Two Population Proportions
Example 2
A pharmaceutical company compares the proportion of patients who recover after receiving Treatment A with the proportion who recover after receiving Treatment B.
Independent groups of patients receive each treatment.
Appropriate Procedure:
Two-Sample z-Test for the Difference Between Two Population Proportions
3.12.A.2 Identifying the Population Parameters
Before conducting the hypothesis test, the population parameters being compared must be clearly identified.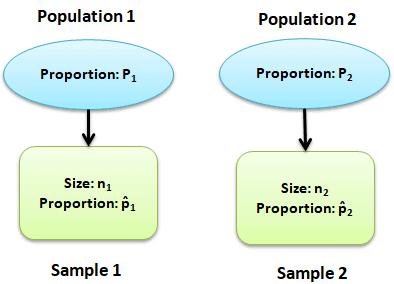
For a two-sample z-test, there are two population proportions:
- \(p_1\) = the true population proportion for Population 1.
- \(p_2\) = the true population proportion for Population 2.
The parameter of interest is the difference between the two population proportions.
\(p_1-p_2\)
On the AP Exam, the parameter statement should clearly identify:
- The two populations.
- The response variable.
- The two population proportions being compared.
Examples of Population Parameters
| Context | Population Parameter |
|---|---|
| School comparison | \(p_1\) = the true proportion of all students at School A who pass the AP Statistics exam; \(p_2\) = the true proportion of all students at School B who pass the AP Statistics exam. |
| Medical study | \(p_1\) = the true proportion of all patients receiving Treatment A who recover; \(p_2\) = the true proportion of all patients receiving Treatment B who recover. |
| Marketing survey | \(p_1\) = the true proportion of all customers using Brand A who are satisfied; \(p_2\) = the true proportion of all customers using Brand B who are satisfied. |
Important AP Exam Notes
- A two-sample z-test is used to compare two independent population proportions.
- The parameter of interest is the difference between the two population proportions, \(p_1-p_2\).
- Always define \(p_1\) and \(p_2\) in the context of the problem.
- The parameter statement should include the two populations, the response variable, and the population proportions.
- Do not describe the sample proportions \(\hat{p}_1\) and \(\hat{p}_2\); the hypotheses concern the population proportions.
Common AP Exam Mistakes
| Incorrect | Correct |
|---|---|
| Using a one-sample z-test to compare two groups. | Use a two-sample z-test when comparing two independent population proportions. |
| Writing only “\(p_1-p_2\)” without context. | Define both population proportions and the populations they represent. |
| Using sample proportions in the parameter statement. | The parameter must refer to the population proportions, not the sample proportions. |
Example
A researcher wants to compare the proportion of registered voters who support a new policy in City A and City B.
Independent random samples are selected from each city.
Identify the appropriate hypothesis testing procedure and state the population parameters in context.
▶️ Answer / Explanation
Appropriate Procedure:
A two-sample z-test for the difference between two population proportions should be used because the goal is to compare two independent population proportions.
Population Parameters:
\(p_1\) = the true proportion of all registered voters in City A who support the new policy.
\(p_2\) = the true proportion of all registered voters in City B who support the new policy.
The parameter of interest is
\(p_1-p_2\)
which represents the difference between the two population proportions.
3.12.B.1 Writing Null and Alternative Hypotheses for the Difference Between Two Population Proportions
When comparing two population proportions, the hypotheses describe whether there is a difference between the two populations.
For a two-sample z-test for the difference between two population proportions, the null hypothesis always states that there is no difference between the two population proportions.
This can be written in either of the following equivalent forms:
\(H_0:p_1=p_2\) or \(H_0:p_1-p_2=0\)
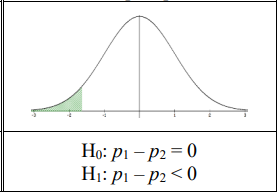
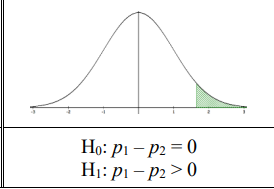
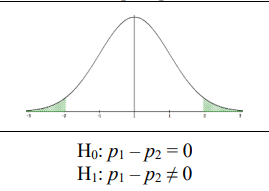
The alternative hypothesis depends on the research question and indicates whether one population proportion is less than, greater than, or different from the other.
Forms of the Alternative Hypothesis
| Research Question | Alternative Hypothesis | Type of Test |
|---|---|---|
Is Population 1’s proportion less than Population 2’s? | \(H_a:p_1<p_2\) or \(H_a:p_1-p_2<0\) | Left-tailed |
Is Population 1’s proportion greater than Population 2’s?
| \(H_a:p_1>p_2\) or \(H_a:p_1-p_2>0\) | Right-tailed |
Are the two population proportions different?
| \(H_a:p_1\neq p_2\) or \(H_a:p_1-p_2\neq0\) | Two-tailed |
Equivalent Ways to Write the Hypotheses
The AP Statistics Exam accepts either notation:
Equivalent Forms
- \(H_0:p_1=p_2\) ≡ \(H_0:p_1-p_2=0\)
- \(H_a:p_1<p_2\) ≡ \(H_a:p_1-p_2<0\)
- \(H_a:p_1>p_2\) ≡ \(H_a:p_1-p_2>0\)
- \(H_a:p_1\neq p_2\) ≡ \(H_a:p_1-p_2\neq0\)
Example 1: Left-Tailed Test
A researcher believes the proportion of students passing an AP exam at School A is lower than at School B.
Hypotheses:
\(H_0:p_1=p_2\)
\(H_a:p_1<p_2\)
Type of Test: Left-tailed
Example 2: Right-Tailed Test
A company believes that the proportion of customers satisfied with Product A is greater than the proportion satisfied with Product B.
Hypotheses:
\(H_0:p_1-p_2=0\)
\(H_a:p_1-p_2>0\)
Type of Test: Right-tailed
Example 3: Two-Tailed Test
A researcher wants to determine whether the proportion of voters supporting a candidate differs between City A and City B.
Hypotheses:
\(H_0:p_1=p_2\)
\(H_a:p_1\neq p_2\)
Type of Test: Two-tailed
Important AP Exam Notes
- The null hypothesis always states no difference between the two population proportions.
- \(H_0:p_1=p_2\) and \(H_0:p_1-p_2=0\) are equivalent.
- The alternative hypothesis determines whether the test is left-tailed, right-tailed, or two-tailed.
- Write hypotheses using the population proportions \(p_1\) and \(p_2\), never the sample proportions \(\hat{p}_1\) and \(\hat{p}_2\).
- Choose the alternative hypothesis based on the wording of the research question.
Common AP Exam Mistakes
| Incorrect | Correct |
|---|---|
| Using \(\hat{p}_1\) and \(\hat{p}_2\) in the hypotheses. | Use the population proportions \(p_1\) and \(p_2\). |
| Writing \(H_0:p_1>p_2\). | The null hypothesis always states equality: \(H_0:p_1=p_2\) or \(H_0:p_1-p_2=0\). |
| Using an equality sign in the alternative hypothesis. | The alternative hypothesis uses only \(<\), \(>\), or \(\neq\). |
Example
A university wants to determine whether the proportion of students who graduate within four years differs between students living on campus and students living off campus.
Write the null hypothesis, the alternative hypothesis, and identify the type of hypothesis test.
▶️ Answer / Explanation
Let
- \(p_1\) = the true proportion of on-campus students who graduate within four years.
- \(p_2\) = the true proportion of off-campus students who graduate within four years.
Null Hypothesis:
\(H_0:p_1=p_2\)
or equivalently
\(H_0:p_1-p_2=0\)
Alternative Hypothesis:
\(H_a:p_1\neq p_2\)
or equivalently
\(H_a:p_1-p_2\neq0\)
Type of Test:
This is a two-tailed two-sample z-test for the difference between two population proportions because the goal is to determine whether the two population proportions differ.
3.12.C.1 Conditions for a Two-Sample z-Test for the Difference Between Two Population Proportions
Before performing a two-sample z-test for the difference between two population proportions, you must verify that the required conditions are satisfied.
These conditions ensure that the sampling distribution of the difference between the sample proportions can be approximated by a Normal distribution, allowing the use of a two-sample z-test.
There are three required conditions:
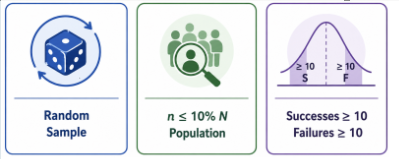
- Randomization Condition — Data must be collected using two independent random samples or from a randomized experiment.
- 10% Condition — When sampling without replacement, each sample size must be no more than 10% of its respective population.
- Normality (Large Counts) Condition — The expected numbers of successes and failures in both samples, calculated using the pooled proportion, must each be at least 10.
Conditions to Verify
| Condition | Requirement |
|---|---|
| Randomization | Two independent random samples or a randomized experiment. |
| 10% Condition | \(n_1\le0.10N_1\) and \(n_2\le0.10N_2\) when sampling without replacement. |
| Normality (Large Counts) | \(n_1\hat{p}_c\ge10,\; n_1(1-\hat{p}_c)\ge10,\; n_2\hat{p}_c\ge10,\; n_2(1-\hat{p}_c)\ge10\) |
The Pooled Proportion
For a two-sample z-test, the Normality Condition uses the combined (pooled) proportion, denoted by \(\hat{p}_c\).
The pooled proportion assumes that the null hypothesis is true (that the two population proportions are equal).
Formula
\(\hat{p}_c=\dfrac{n_1\hat{p}_1+n_2\hat{p}_2}{n_1+n_2}\)
Where:
- \(n_1\) = Sample size from Population 1
- \(n_2\) = Sample size from Population 2
- \(\hat{p}_1\) = Sample proportion from Population 1
- \(\hat{p}_2\) = Sample proportion from Population 2
- \(\hat{p}_c\) = Combined (pooled) sample proportion
Normality (Large Counts) Condition
After calculating the pooled proportion, verify all four conditions:
- \(n_1\hat{p}_c\ge10\)
- \(n_1(1-\hat{p}_c)\ge10\)
- \(n_2\hat{p}_c\ge10\)
- \(n_2(1-\hat{p}_c)\ge10\)
All four inequalities must be satisfied before performing the two-sample z-test.
Example
A researcher compares two teaching methods.
- Method A: 90 successes out of 150 students.
- Method B: 75 successes out of 150 students.
Step 1: Calculate the pooled proportion.
\(\hat{p}_c=\dfrac{90+75}{150+150}=\dfrac{165}{300}=0.55\)
Step 2: Check the Normality Condition.
\(150(0.55)=82.5\ge10\)
\(150(0.45)=67.5\ge10\)
The same values apply for the second sample because both sample sizes are 150.
Since all four expected counts are at least 10, the Normality Condition is satisfied.
Step 3: Check the remaining conditions.
- The samples were selected independently using random sampling.
- Each sample is less than 10% of its respective population.
Conclusion:
All three conditions are satisfied, so a two-sample z-test for the difference between two population proportions is appropriate.
Important AP Exam Notes
- For a two-sample z-test, use two independent random samples or a randomized experiment.
- The 10% Condition must be checked for each sample separately when sampling without replacement.
- The Normality Condition uses the pooled proportion \(\hat{p}_c\), not the individual sample proportions.
- All four expected counts must be at least 10.
- The pooled proportion is calculated under the assumption that the null hypothesis is true.
Common AP Exam Mistakes
| Incorrect | Correct |
|---|---|
| Using \(\hat{p}_1\) and \(\hat{p}_2\) separately to check the Large Counts Condition. | Use the pooled proportion \(\hat{p}_c\). |
| Checking the 10% Condition for only one sample. | Verify the condition separately for both samples. |
| Using dependent samples. | The two samples must be independent. |
Example
A study compares two brands of batteries.
Brand A: 110 successes out of 200 batteries.
Brand B: 130 successes out of 250 batteries.
Determine whether it is appropriate to perform a two-sample z-test for the difference between two population proportions.
▶️ Answer / Explanation
Step 1: Verify Randomization.
The two samples are independent random samples, so this condition is satisfied.
Step 2: Verify the 10% Condition.
Each sample is less than 10% of its respective population, so the condition is satisfied.
Step 3: Calculate the pooled proportion.
\(\hat{p}_c=\dfrac{110+130}{200+250}=\dfrac{240}{450}=0.533\)
Step 4: Check the Large Counts Condition.
\(200(0.533)=106.6\ge10\)
\(200(0.467)=93.4\ge10\)
\(250(0.533)=133.3\ge10\)
\(250(0.467)=116.7\ge10\)
Conclusion:
All three conditions are satisfied, so it is appropriate to perform a two-sample z-test for the difference between two population proportions.