
3.13.A.1 Calculating the Test Statistic for a Two-Sample z-Test for the Difference Between Two Population Proportions
After verifying that all conditions for a two-sample z-test are satisfied, the next step is to calculate the test statistic.
The test statistic measures how many standard errors the observed difference between the two sample proportions is from the hypothesized difference.
For most AP Statistics problems, the null hypothesis states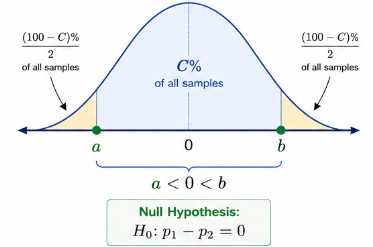
\(H_0:p_1-p_2=0\)
meaning there is no difference between the two population proportions.
Under this assumption, the test statistic follows an approximately standard Normal distribution.
Formula for the Test Statistic
\(z=\dfrac{(\hat{p}_1-\hat{p}_2)-0}{\sqrt{\hat{p}_c(1-\hat{p}_c)\left(\dfrac{1}{n_1}+\dfrac{1}{n_2}\right)}}\)
Combined (Pooled) Proportion
\(\hat{p}_c=\dfrac{n_1\hat{p}_1+n_2\hat{p}_2}{n_1+n_2}\)
Where:
- \(\hat{p}_1\) = Sample proportion from Population 1
- \(\hat{p}_2\) = Sample proportion from Population 2
- \(n_1\) = Sample size from Population 1
- \(n_2\) = Sample size from Population 2
- \(\hat{p}_c\) = Combined (pooled) sample proportion
- \(z\) = Test statistic
Understanding the Formula
- The numerator, \((\hat{p}_1-\hat{p}_2)-0\), measures the observed difference between the two sample proportions.
- The denominator is the standard error calculated using the pooled proportion, assuming the null hypothesis is true.
- The test statistic tells us how many standard errors the observed difference is from 0.
Interpreting the Test Statistic
| Value of \(z\) | Interpretation |
|---|---|
| Approximately 0 | The two sample proportions are very similar. |
| Large positive value | \(\hat{p}_1\) is much greater than \(\hat{p}_2\). |
| Large negative value | \(\hat{p}_1\) is much less than \(\hat{p}_2\). |
Example 1
A researcher compares two study methods.
- Method A: 96 successes out of 150 students.
- Method B: 75 successes out of 150 students.
Step 1: Calculate the sample proportions.
\(\hat{p}_1=\dfrac{96}{150}=0.64\)
\(\hat{p}_2=\dfrac{75}{150}=0.50\)
Step 2: Calculate the pooled proportion.
\(\hat{p}_c=\dfrac{96+75}{150+150}=\dfrac{171}{300}=0.57\)
Step 3: Calculate the standard error.
\(SE=\sqrt{0.57(0.43)\left(\dfrac{1}{150}+\dfrac{1}{150}\right)}\approx0.0572\)
Step 4: Calculate the test statistic.
\(z=\dfrac{0.64-0.50}{0.0572}\approx2.45\)
Interpretation:
The observed difference between the two sample proportions is approximately 2.45 standard errors above 0.
Example 2
A company compares customer satisfaction between two products.
- Product A: 84 satisfied out of 120 customers.
- Product B: 96 satisfied out of 120 customers.
Step 1:
\(\hat{p}_1=0.70,\qquad \hat{p}_2=0.80\)
Step 2:
\(\hat{p}_c=\dfrac{84+96}{240}=0.75\)
Step 3:
\(SE=\sqrt{0.75(0.25)\left(\dfrac{1}{120}+\dfrac{1}{120}\right)}\approx0.0559\)
Step 4:
\(z=\dfrac{0.70-0.80}{0.0559}\approx-1.79\)
Interpretation:
The observed difference between the two sample proportions is approximately 1.79 standard errors below 0.
Important AP Exam Notes
- For a two-sample z-test, the hypothesized difference is almost always 0.
- Always calculate the standard error using the pooled proportion \(\hat{p}_c\).
- The pooled proportion assumes the null hypothesis is true.
- The test statistic follows an approximately standard Normal distribution when the required conditions are satisfied.
- A positive z-score indicates \(\hat{p}_1>\hat{p}_2\); a negative z-score indicates \(\hat{p}_1<\hat{p}_2\).
Common AP Exam Mistakes
| Incorrect | Correct |
|---|---|
| Using separate sample proportions in the standard error. | Use the pooled proportion \(\hat{p}_c\). |
| Forgetting to subtract the hypothesized difference (0). | The numerator is \((\hat{p}_1-\hat{p}_2)-0\). |
| Interpreting the test statistic as a probability. | The test statistic measures the number of standard errors from the hypothesized difference. |
Example
A study compares two advertisements.
- Advertisement A: 135 purchases out of 250 customers.
- Advertisement B: 110 purchases out of 250 customers.
Calculate the test statistic for testing whether the two population proportions are equal.
▶️ Answer / Explanation
Step 1:
\(\hat{p}_1=\dfrac{135}{250}=0.54\)
\(\hat{p}_2=\dfrac{110}{250}=0.44\)
Step 2:
\(\hat{p}_c=\dfrac{135+110}{500}=0.49\)
Step 3:
\(SE=\sqrt{0.49(0.51)\left(\dfrac{1}{250}+\dfrac{1}{250}\right)}\approx0.0447\)
Step 4:
\(z=\dfrac{0.54-0.44}{0.0447}\approx2.24\)
Answer:
The test statistic is approximately 2.24, indicating that the observed difference is about 2.24 standard errors above the hypothesized difference of 0.
3.13.A.2 Finding the p-value for a Two-Sample z-Test Using the Standard Normal Distribution
After calculating the test statistic for a two-sample z-test, the next step is to determine the p-value.
The p-value is calculated from the standard Normal distribution because, when the null hypothesis is true and all required conditions are satisfied, the test statistic follows an approximately standard Normal distribution.
On the AP Statistics Exam, the p-value may be found using:
- A standard Normal (z) table.
- A graphing calculator.
- Statistical software or other approved technology.
Finding the p-value
| Alternative Hypothesis | p-value | Illustration |
|---|---|---|
Right-Tailed Test \(H_a:p_1-p_2>0\) Population 1 proportion is greater than Population 2. | p-value \(P(Z>z_{obs})\) Area to the right of the observed test statistic. | 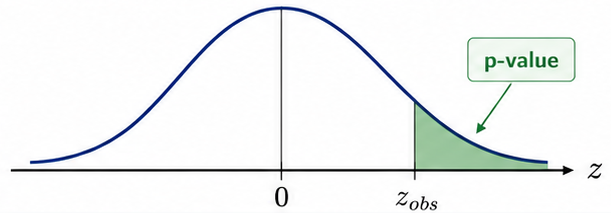 |
Left-Tailed Test \(H_a:p_1-p_2<0\) Population 1 proportion is less than Population 2. | p-value \(P(Z<z_{obs})\) Area to the left of the observed test statistic. | 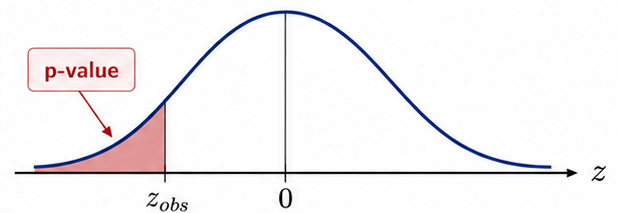 |
Two-Tailed Test \(H_a:p_1-p_2\neq0\) The two population proportions are different. | p-value \(P(|Z|>|z_{obs}|)\) Area in both tails beyond \(\pm|z_{obs}|\). | 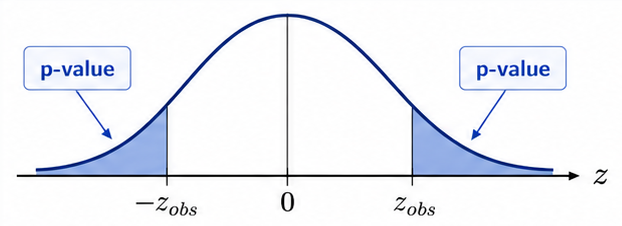 |
Example 1: Right-Tailed Test
A two-sample z-test produces
\(z=2.18\)
with the alternative hypothesis
\(H_a:p_1-p_2>0\)
The p-value is
\(P(Z\ge2.18)\approx0.0146\)
Example 2: Left-Tailed Test
A two-sample z-test produces
\(z=-1.94\)
with
\(H_a:p_1-p_2<0\)
The p-value is
\(P(Z\le-1.94)\approx0.0262\)
Example 3: Two-Tailed Test
A two-sample z-test produces
\(z=2.31\)
with
\(H_a:p_1-p_2\neq0\)
First find one tail:
\(P(Z\ge2.31)\approx0.0104\)
Then double the probability:
p-value \(=2(0.0104)=0.0208\)
Important AP Exam Notes
- The p-value is calculated from the standard Normal distribution after finding the test statistic.
- The direction of the alternative hypothesis determines whether to use the left tail, right tail, or both tails.
- Technology is commonly used on the AP Statistics Exam because it provides a more accurate p-value than a z-table.
- The p-value is always calculated assuming the null hypothesis is true.
- For a two-sided test, always include both tails of the distribution.
Common AP Exam Mistakes
| Incorrect | Correct |
|---|---|
| Using only one tail for a two-sided test. | Include probabilities from both tails. |
| Using the wrong tail based on the alternative hypothesis. | Choose the tail(s) according to the alternative hypothesis. |
| Using the sample proportions directly to calculate the p-value. | Use the calculated z-test statistic. |
Example
A researcher wants to determine whether the proportion of customers satisfied with Store A differs from the proportion satisfied with Store B.
After verifying the conditions, a graphing calculator is used to perform a 2-PropZTest.
The calculator output reports:F
- Test Statistic: \(z=2.47\)
- p-value: \(0.0135\)
The hypotheses are
\(H_0:p_1-p_2=0\)
\(H_a:p_1-p_2\neq0\)
Interpret the calculator output.
▶️ Answer / Explanation
The graphing calculator reports a p-value of 0.0135.
This means that, assuming the true population proportions for Store A and Store B are equal, there is a 1.35% chance of obtaining a difference in sample proportions at least as extreme as the one observed due to random sampling alone.
Because the p-value is small, the observed difference provides convincing statistical evidence that the true population proportions for the two stores are different.
3.13.C.1 Making a Formal Decision Using the p-value
After calculating the p-value for a two-sample z-test, compare it to the significance level, denoted by \(\alpha\).
The significance level is chosen before the data are analyzed and serves as the cutoff for determining whether the observed difference between the two population proportions is statistically significant.
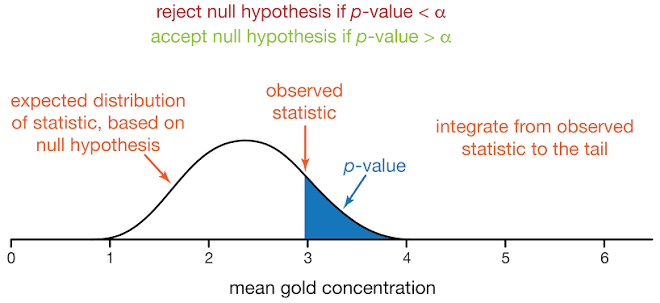
Decision Rule
| Comparison | Decision |
|---|---|
| \(p\text{-value}\le\alpha\) | Reject \(H_0\) |
| \(p\text{-value}>\alpha\) | Fail to Reject \(H_0\) |
Example 1
A two-sample z-test comparing two population proportions produces
\(p\text{-value}=0.031\)
with
\(\alpha=0.05\)
Since
\(0.031\le0.05\)
Decision: Reject the null hypothesis.
Example 2
A two-sample z-test produces
\(p\text{-value}=0.18\)
with
\(\alpha=0.05\)
Since
\(0.18>0.05\)
Decision: Fail to reject the null hypothesis.
3.13.C.2 Using the Hypothesis Test to Answer an Investigative Question
The purpose of a two-sample hypothesis test is to answer an investigative question about whether the two population proportions differ.
The results of the hypothesis test provide statistical reasoning to determine whether the observed difference between the two samples is convincing evidence of a difference between the two populations.
The conclusion should answer the original research question, not simply state the statistical decision.
Example
Investigative Question:
- “Is the proportion of students who pass the AP Statistics exam different between School A and School B?”
- If the hypothesis test leads to rejecting the null hypothesis, the investigative question can be answered as:
- “There is convincing statistical evidence that the proportion of students who pass the AP Statistics exam differs between School A and School B.”
3.13.C.3 Writing a Conclusion in Context
The final conclusion of a hypothesis test should always be written in the context of the problem.
A complete AP Statistics conclusion should:
- Be consistent with the decision to reject or fail to reject the null hypothesis.
- Be written in terms of the alternative hypothesis.
- Use non-definitive language, such as “there is convincing statistical evidence” or “there is not convincing statistical evidence.”
- Reference the population proportions and the two populations being compared.
Recommended AP Exam Wording
| Decision | Appropriate Conclusion |
|---|---|
| Reject \(H_0\) | There is convincing statistical evidence that the true population proportions differ (or that one is greater/less than the other, depending on \(H_a\)). |
| Fail to Reject \(H_0\) | There is not convincing statistical evidence that the true population proportions differ (or that one is greater/less than the other). |
Example 1: Reject the Null Hypothesis
A study compares the proportion of voters supporting a proposed law in City A and City B.
The hypothesis test results in rejecting \(H_0\).
Appropriate Conclusion:
There is convincing statistical evidence that the true proportion of voters who support the proposed law is different between City A and City B.
Example 2: Fail to Reject the Null Hypothesis
A researcher compares the proportion of customers satisfied with Store A and Store B.
The hypothesis test results in failing to reject \(H_0\).
Appropriate Conclusion:
There is not convincing statistical evidence that the true proportions of satisfied customers differ between Store A and Store B.
Important AP Exam Notes
- Always compare the p-value with the significance level \(\alpha\) before making a decision.
- If \(p\text{-value}\le\alpha\), reject the null hypothesis.
- If \(p\text{-value}>\alpha\), fail to reject the null hypothesis.
- Answer the original investigative question using the statistical results.
- Write conclusions in terms of the alternative hypothesis and use non-definitive language.
- Never state that the null hypothesis has been proven or accepted.
Common AP Exam Mistakes
| Incorrect | Correct |
|---|---|
| Accept the null hypothesis. | Fail to reject the null hypothesis. |
| The two population proportions are equal. | There is not convincing statistical evidence that the two population proportions differ. |
| The alternative hypothesis is proven. | There is convincing statistical evidence supporting the alternative hypothesis. |
| Writing the conclusion without mentioning the populations. | State the conclusion in context and identify the two populations. |
Example
A researcher compares the proportion of homeowners who support a recycling program in Town A and Town B.
A graphing calculator performs a 2-PropZTest and reports:
- p-value = 0.042
The significance level is
\(\alpha=0.05\)
Write the statistical decision and the conclusion in context.
▶️ Answer / Explanation
Step 1: Compare the p-value with the significance level.
\(0.042\le0.05\)
Decision:
Reject the null hypothesis.
Conclusion:
There is convincing statistical evidence that the true proportion of homeowners who support the recycling program differs between Town A and Town B.