
3.14.A.1 Understanding the Chi-Square Statistic
A chi-square (\(\chi^2\)) statistic measures how closely the observed counts from the data match the expected counts predicted by a statistical model.
- It measures the overall difference between the observed counts and the expected counts, relative to the expected counts.
- If the observed counts are very close to the expected counts, the chi-square statistic will be small.
- If the observed counts differ greatly from the expected counts, the chi-square statistic will be large.
Chi-Square Statistic Formula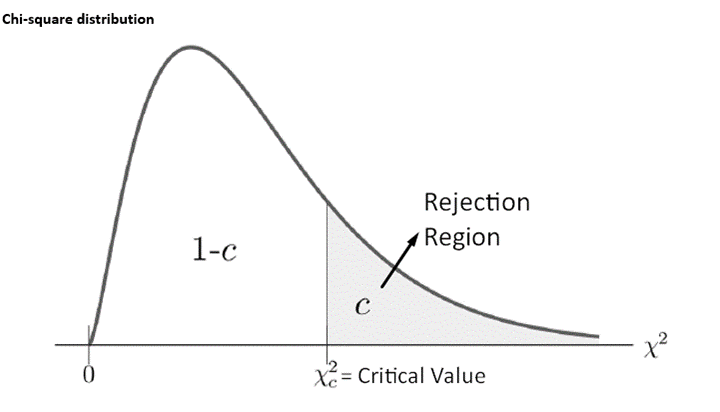
\(\chi^2=\sum\dfrac{(O-E)^2}{E}\)
Where:
- \(O\) = Observed count
- \(E\) = Expected count
- \(\sum\) = Add the values for all categories or cells
How the Formula Works
- Find the difference between each observed and expected count.
- Square each difference so all values are positive.
- Divide each squared difference by its corresponding expected count.
- Add all of the values to obtain the chi-square statistic.
Interpreting the Chi-Square Statistic
| Chi-Square Statistic | Interpretation |
|---|---|
| Small | Observed counts are close to the expected counts. |
| Large | Observed counts differ substantially from the expected counts. |
Example 1
A survey predicts that 50 students should prefer online learning.
The observed count is 55.
The contribution to the chi-square statistic is
\(\dfrac{(55-50)^2}{50}=\dfrac{25}{50}=0.50\)
This small contribution indicates that the observed count is close to the expected count.
Example 2
An expected count for a category is 40, but the observed count is 60.
The contribution is
\(\dfrac{(60-40)^2}{40}=\dfrac{400}{40}=10\)
This larger contribution indicates that the observed count differs substantially from the expected count.
3.14.A.2 Shape of the Chi-Square Distribution
The chi-square distribution is the probability distribution used with chi-square test statistics.
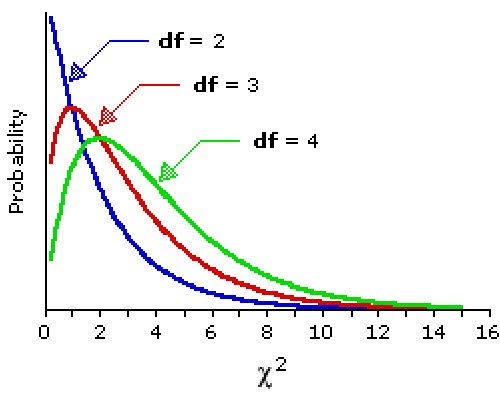
Unlike the standard Normal distribution, the chi-square distribution:
- Contains only positive values.
- Is skewed to the right.
- Has a different shape depending on the degrees of freedom (df).
As the degrees of freedom increase, the distribution becomes less skewed and more nearly symmetric.
Characteristics of the Chi-Square Distribution
| Characteristic | Description |
|---|---|
| Possible Values | Only positive values (\(\chi^2\ge0\)) |
| Shape | Right-skewed |
| Degrees of Freedom | Different values of \(df\) produce different chi-square distributions. |
| Effect of Increasing \(df\) | The distribution becomes less skewed and more spread out. |
Example
A chi-square test with
\(df=2\)
has a noticeably right-skewed distribution.
A chi-square test with
\(df=20\)
has a distribution that is still right-skewed but much less so than when \(df=2\).
Important AP Exam Notes
- The chi-square statistic measures the difference between observed and expected counts.
- Small values of \(\chi^2\) indicate that the observed counts are close to the expected counts.
- Large values of \(\chi^2\) indicate greater disagreement between the observed and expected counts.
- The chi-square distribution contains only nonnegative values.
- Every chi-square distribution is right-skewed.
- As the degrees of freedom increase, the distribution becomes less skewed.
Common AP Exam Mistakes
| Incorrect | Correct |
|---|---|
| A chi-square statistic can be negative. | A chi-square statistic is always zero or positive. |
| A larger chi-square statistic means the model fits better. | A larger chi-square statistic indicates greater disagreement between observed and expected counts. |
| The chi-square distribution is symmetric. | The chi-square distribution is right-skewed. |
Example
A goodness-of-fit test compares observed counts with expected counts for four categories.
The calculated chi-square statistic is
\(\chi^2=9.84\)
Explain what this statistic measures and describe one characteristic of the chi-square distribution.
▶️ Answer / Explanation
The chi-square statistic measures the overall difference between the observed counts and the expected counts, relative to the expected counts.
A value of \(\chi^2=9.84\) indicates the observed counts differ from the expected counts by this overall amount.
One characteristic of the chi-square distribution is that it contains only nonnegative values and is skewed to the right.
3.14.B.1 Identifying the Appropriate Chi-Square Test
When analyzing categorical data displayed in a two-way table, the appropriate chi-square test depends on the purpose of the study.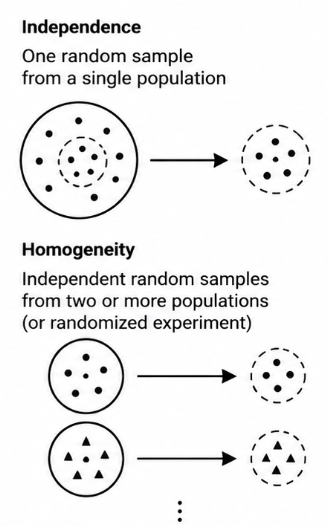
There are two commonly used chi-square tests:
- Chi-Square Test for Homogeneity
- Chi-Square Test for Independence
Although both tests use the same chi-square statistic and calculations, they answer different statistical questions.
Chi-Square Test for Homogeneity
The chi-square test for homogeneity is used to determine whether the distribution of a categorical variable is the same across two or more populations.
Data are collected from two or more independent populations or treatment groups, and the categorical responses are compared.
When to Use
- Compare two or more populations.
- One categorical response variable is measured for each population.
- Determine whether the distributions are the same or different.
Example 1
A researcher compares the preferred social media platform of students from three different schools.
Question:
Is the distribution of preferred social media platforms the same for students from the three schools?
Appropriate Test:
Chi-Square Test for Homogeneity
Example 2
A company surveys customers from four different stores to compare their preferred payment method.
Appropriate Test:
Chi-Square Test for Homogeneity
3.14.B.2 Identifying the Population Parameter for a Test for Homogeneity
For a chi-square test for homogeneity, the parameter should describe:
- The categorical response variable.
- The two or more populations being compared.
The parameter should always be written in context.
Examples of Appropriate Parameter Statements
| Study | Population Parameter |
|---|---|
| Favorite social media platform at three schools | The distribution of preferred social media platforms for students at each of the three schools. |
| Preferred payment method at four stores | The distribution of preferred payment methods for customers at each of the four stores. |
Homogeneity vs. Independence (Preview)
| Homogeneity | Independence |
|---|---|
| Compares distributions across multiple populations. | Examines the relationship between two categorical variables within a single population. |
Important AP Exam Notes
- Use a chi-square test for homogeneity when comparing the distribution of a categorical variable across two or more populations.
- The populations should be independent.
- The parameter statement should identify the categorical variable and the populations in context.
- Do not confuse a test for homogeneity with a test for independence.
Common AP Exam Mistakes
| Incorrect | Correct |
|---|---|
| Using a test for independence when comparing different populations. | Use a chi-square test for homogeneity. |
| Describing only the categorical variable. | Reference both the categorical variable and the populations being compared. |
| Assuming homogeneity tests use one population. | Homogeneity compares multiple populations. |
Example
A university surveys students from three different campuses to compare their preferred mode of transportation to class (car, bus, bicycle, or walking).
Identify the appropriate statistical test and describe the population parameter in context.
▶️ Answer / Explanation
Appropriate Test:
A chi-square test for homogeneity because the goal is to compare the distribution of one categorical variable (preferred mode of transportation) across three different populations (the campuses).
Population Parameter:
The distribution of preferred modes of transportation for students at each of the three university campuses.
3.14.B.3 Identifying a Chi-Square Test for Independence
The chi-square test for independence is used to determine whether two categorical variables are associated in a single population.
Unlike a chi-square test for homogeneity, data for a test of independence are collected from one random sample taken from a single population.
Each individual in the sample is classified according to two categorical variables, and the goal is to determine whether the variables are related.
When to Use
- One random sample is selected from a single population.
- Each individual is classified according to two categorical variables.
- Determine whether the two variables are associated (dependent) or independent.
Example 1
A random sample of high school students is selected.
For each student, the researcher records:
- Grade Level (9th, 10th, 11th, 12th)
- Preferred Lunch Option (School Lunch or Packed Lunch)
Question:
Is preferred lunch option associated with grade level?
Appropriate Test:
Chi-Square Test for Independence
Example 2
A researcher randomly samples adults from one city and records:
- Employment Status
- Home Ownership Status
Question:
Are employment status and home ownership associated?
Appropriate Test:
Chi-Square Test for Independence
3.14.B.4 Identifying the Population Parameter for a Test for Independence
For a chi-square test for independence, the parameter should reference:
- The two categorical variables.
- The single population from which the sample was selected.
The parameter should always be written in context.
Examples of Appropriate Parameter Statements
| Study | Population Parameter |
|---|---|
| Lunch preference and grade level | The association between grade level and preferred lunch option for all students at the school. |
| Employment and home ownership | The association between employment status and home ownership among all adults in the city. |
Homogeneity vs. Independence
| Chi-Square Test for Homogeneity | Chi-Square Test for Independence |
|---|---|
| Compares distributions across two or more populations. | Examines the relationship between two categorical variables in one population. |
| Uses two or more independent samples (or treatment groups). | Uses one random sample from a single population. |
| Question: Are the distributions the same? | Question: Are the two variables associated? |
Important AP Exam Notes
- Use a chi-square test for independence when studying the relationship between two categorical variables.
- The data come from one random sample taken from a single population.
- The parameter statement should reference the two categorical variables and the population.
- Do not confuse a test for independence with a test for homogeneity.
Common AP Exam Mistakes
| Incorrect | Correct |
|---|---|
| Using a test for homogeneity with one population. | Use a chi-square test for independence when there is one population and two categorical variables. |
| Referring to multiple populations. | A test for independence involves only one population. |
| Describing only one categorical variable. | Reference both categorical variables in the parameter statement. |
Example
A researcher randomly selects 500 college students from one university.
Each student is classified by:
- Class Year (Freshman, Sophomore, Junior, Senior)
- Housing Type (On-campus or Off-campus)
Identify the appropriate statistical test and describe the population parameter in context.
▶️ Answer / Explanation
Appropriate Test:
A chi-square test for independence because one random sample was taken from a single population, and the goal is to determine whether two categorical variables are associated.
Population Parameter:
The association between class year and housing type for all students at the university.
3.14.D.1 Conditions for a Chi-Square Test for Homogeneity or Independence
Before performing a chi-square test for homogeneity or a chi-square test for independence, you must verify that the required conditions are satisfied.
These conditions ensure that the chi-square distribution provides an appropriate model for the test statistic.
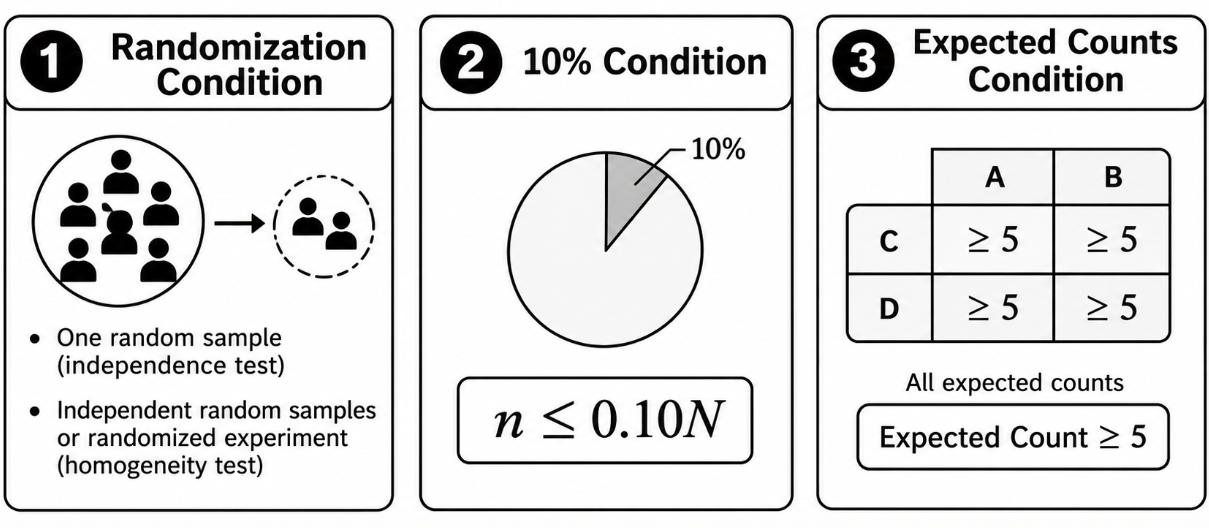
There are three required conditions.
1. Randomization Condition
The method of data collection depends on the type of chi-square test being performed.
- Chi-Square Test for Independence: The data should be collected using one random sample from a single population.
- Chi-Square Test for Homogeneity: The data should be collected using independent random samples from two or more populations or from a randomized experiment.
This condition ensures that the observations are representative of the population(s).
2. 10% Condition
When sampling without replacement, the sample size should be no more than 10% of the population size.
\(n\le0.10N\)
Where:
- \(n\) = Sample size
- \(N\) = Population size
Note: This condition is not required when the data come from a randomized experiment because treatments are randomly assigned rather than sampled from a population.
3. Expected Counts Condition
Every expected count in the two-way table must be at least 5.
Expected Count \(\ge5\)
If even one expected count is less than 5, the chi-square approximation may not be reliable.
Summary of Conditions
| Condition | Requirement |
|---|---|
| Randomization | Independence: one random sample. Homogeneity: independent random samples or a randomized experiment. |
| 10% Condition | \(n\le0.10N\) when sampling without replacement. |
| Expected Counts | Every expected count must be at least 5. |
Example 1: Chi-Square Test for Independence
A random sample of 250 students is selected from one high school.
Each student is classified by:
- Grade Level
- Participation in School Clubs
The expected counts for every cell are greater than 5.
Condition Check
- ✔ One random sample
- ✔ Sample size is less than 10% of the population
- ✔ Every expected count is at least 5
Conclusion:
It is appropriate to perform a chi-square test for independence.
Example 2: Chi-Square Test for Homogeneity
A researcher randomly samples voters from three different cities to compare political party preference.
Each city’s sample is independent, and every expected count is at least 5.
Condition Check
- ✔ Independent random samples
- ✔ Each sample satisfies the 10% Condition
- ✔ Every expected count is at least 5
Conclusion:
It is appropriate to perform a chi-square test for homogeneity.
Important AP Exam Notes
- Both chi-square tests require the Randomization Condition, the 10% Condition (when applicable), and the Expected Counts Condition.
- For a test of independence, data come from one random sample.
- For a test of homogeneity, data come from independent random samples or a randomized experiment.
- Every expected count must be at least 5.
- The 10% Condition is unnecessary for randomized experiments.
Common AP Exam Mistakes
| Incorrect | Correct |
|---|---|
| Checking observed counts instead of expected counts. | Verify that every expected count is at least 5. |
| Using multiple populations for a test of independence. | A test of independence uses one random sample from one population. |
| Using one random sample for a test of homogeneity. | A test of homogeneity uses independent random samples or a randomized experiment. |
| Applying the 10% Condition to a randomized experiment. | The 10% Condition is not required for randomized experiments. |
Example
A researcher wants to determine whether political party affiliation is associated with age group.
A random sample of 600 registered voters is selected from one state.
Technology produces the following expected counts for the six cells of the two-way table:
85.2, 94.8, 102.4, 96.1, 111.5, 110.0
Determine whether it is appropriate to perform a chi-square test.
▶️ Answer / Explanation
Randomization Condition:
A single random sample was selected, so this condition is satisfied.
10% Condition:
The sample size is less than 10% of the state’s registered voters, so this condition is satisfied.
Expected Counts Condition:
All expected counts are greater than 5.
Conclusion:
All three conditions are satisfied, so it is appropriate to perform a chi-square test for independence.