
3.15.A.1 Calculating Expected Counts in a Two-Way Table
For a chi-square test for homogeneity or a chi-square test for independence, the expected count represents the number of observations that would be expected in each cell of the two-way table if the null hypothesis were true.
The expected counts are calculated using the row totals, column totals, and the overall table total.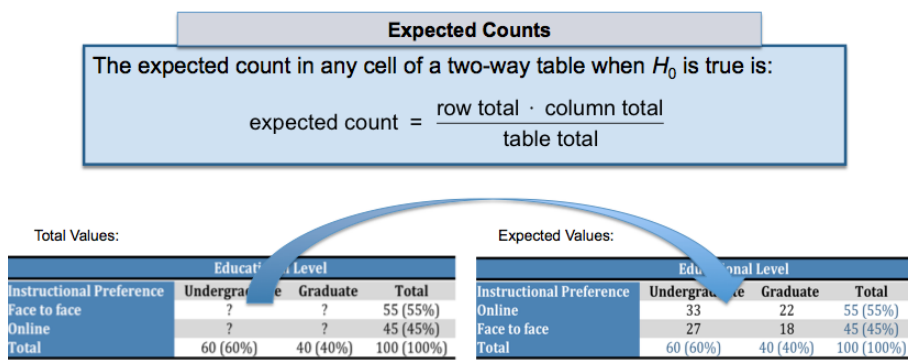
Formula for an Expected Count
\(\text{Expected Count}=\dfrac{(\text{Row Total})(\text{Column Total})}{\text{Grand Total}}\)
Where:
- Row Total = Total number of observations in the row.
- Column Total = Total number of observations in the column.
- Grand Total = Total number of observations in the entire table.
Understanding Expected Counts
- Expected counts are calculated assuming the null hypothesis is true.
- They are used to compare with the observed counts when calculating the chi-square statistic.
- Every cell in a two-way table has its own expected count.
Step-by-Step Procedure
- Find the row total for the cell.
- Find the column total for the cell.
- Multiply the row total by the column total.
- Divide by the grand total.
Example 1
A two-way table summarizes students’ preferred study method.
| Online | In Person | Row Total | |
|---|---|---|---|
| Grade 11 | 42 | 58 | 100 |
| Grade 12 | 78 | 22 | 100 |
| Column Total | 120 | 80 | 200 |
Find the expected count for Grade 11 students who prefer Online learning.
Solution
Expected Count
\(=\dfrac{(100)(120)}{200}\)
\(=60\)
The expected count for this cell is 60.
Example 2
A survey of 300 adults records employment status and home ownership.
- The row total for employed adults is 180.
- The column total for homeowners is 210.
Find the expected count for employed homeowners.
Solution
\(\dfrac{(180)(210)}{300}=126\)
The expected count is 126.
Observed Counts vs. Expected Counts
| Observed Count | Expected Count |
|---|---|
| Actual number observed in the sample. | Number expected if the null hypothesis is true. |
| Collected directly from the data. | Calculated using row totals, column totals, and the grand total. |
Important AP Exam Notes
- Expected counts are calculated under the assumption that the null hypothesis is true.
- Every cell in the two-way table has its own expected count.
- Use the formula:
\(\text{Expected Count}=\dfrac{(\text{Row Total})(\text{Column Total})}{\text{Grand Total}}\)
- Expected counts are used to calculate the chi-square statistic.
- For chi-square procedures, every expected count should be at least 5.
Common AP Exam Mistakes
| Incorrect | Correct |
|---|---|
| Using observed counts in the formula. | Use the row total, column total, and grand total. |
| Using the wrong row or column total. | Use the totals corresponding to the specific cell. |
| Thinking expected counts are observed values. | Expected counts are calculated assuming the null hypothesis is true. |
Example
A survey records whether adults own a pet and whether they live in an urban or rural area.
| Own a Pet | Do Not Own a Pet | Row Total | |
|---|---|---|---|
| Urban | ? | 180 | |
| Rural | 120 | ||
| Column Total | 150 | 150 | 300 |
Calculate the expected count for the number of urban adults who own a pet.
▶️ Answer / Explanation
Use the expected count formula:
\(\text{Expected Count}=\dfrac{(\text{Row Total})(\text{Column Total})}{\text{Grand Total}}\)
\(=\dfrac{(180)(150)}{300}\)
\(=90\)
Answer: The expected count is 90.
3.15.B.1 Calculating the Chi-Square Test Statistic
After calculating the expected counts, the next step is to calculate the chi-square test statistic.
The chi-square statistic measures the overall difference between the observed counts and the expected counts for all cells in the two-way table.
Large values of the chi-square statistic indicate that the observed counts differ substantially from the expected counts, providing evidence against the null hypothesis.
Chi-Square Test Statistic Formula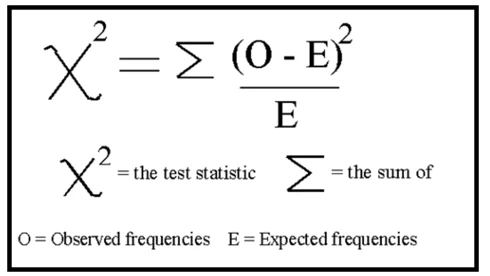
\(\chi^2=\sum\dfrac{(\text{Observed Count}-\text{Expected Count})^2}{\text{Expected Count}}\)
Where:
- Observed Count (O) = Actual count from the data.
- Expected Count (E) = Count expected if the null hypothesis is true.
- \(\sum\) = Add the contribution from every cell in the table.
Degrees of Freedom
After calculating the chi-square statistic, it is compared to a chi-square distribution with
\(\text{Degrees of Freedom}=(\text{Number of Rows}-1)(\text{Number of Columns}-1)\)
How to Calculate the Chi-Square Statistic
- Find the observed count for each cell.
- Calculate the expected count for each cell.
- Compute
\(\dfrac{(O-E)^2}{E}\)
- Add the values from every cell.
Example
A researcher wants to determine whether grade level and club participation are independent.
The following observed counts are collected.
| Participates | Does Not Participate | Row Total | |
|---|---|---|---|
| Grade 11 | 40 | 20 | 60 |
| Grade 12 | 30 | 30 | 60 |
| Column Total | 70 | 50 | 120 |
Step 1: Calculate the Expected Counts
| Cell | Expected Count |
|---|---|
| Grade 11, Participates | \(\dfrac{60\times70}{120}=35\) |
| Grade 11, Does Not Participate | \(\dfrac{60\times50}{120}=25\) |
| Grade 12, Participates | 35 |
| Grade 12, Does Not Participate | 25 |
Step 2: Compute Each Chi-Square Contribution
| Cell | Calculation | Contribution |
|---|---|---|
| Grade 11, Participates | \(\dfrac{(40-35)^2}{35}\) | 0.714 |
| Grade 11, Does Not Participate | \(\dfrac{(20-25)^2}{25}\) | 1.000 |
| Grade 12, Participates | \(\dfrac{(30-35)^2}{35}\) | 0.714 |
| Grade 12, Does Not Participate | \(\dfrac{(30-25)^2}{25}\) | 1.000 |
Step 3: Add the Contributions
\(\chi^2=0.714+1.000+0.714+1.000=3.428\)
Step 4: Calculate the Degrees of Freedom
\(df=(2-1)(2-1)=1\)
Result
The chi-square test statistic is
\(\boxed{\chi^2\approx3.43}\)
with
\(\boxed{df=1}\)
Interpreting the Chi-Square Statistic
| Chi-Square Value | Interpretation |
|---|---|
| Small | Observed counts are close to the expected counts. |
| Large | Observed counts differ substantially from the expected counts. |
Important AP Exam Notes
- Calculate the expected counts before finding the chi-square statistic.
- Compute \(\dfrac{(O-E)^2}{E}\) for every cell.
- Add the contributions from all cells.
- Degrees of freedom are calculated using
\((\text{rows}-1)(\text{columns}-1)\)
- Larger values of \(\chi^2\) indicate greater disagreement between observed and expected counts.
Common AP Exam Mistakes
| Incorrect | Correct |
|---|---|
| Subtracting row totals from column totals. | Use observed and expected counts for each cell. |
| Forgetting to divide by the expected count. | Every contribution is divided by its expected count. |
| Using the wrong degrees of freedom formula. | Use \((\text{rows}-1)(\text{columns}-1)\). |
Example
The following table shows the observed counts for a study investigating whether pet ownership is associated with living area.
| Own Pet | No Pet | |
|---|---|---|
| Urban | 60 | 40 |
| Rural | 90 | 30 |
Calculate the chi-square test statistic.
▶️ Answer / Explanation
Step 1: Find the expected counts.
Urban, Own Pet: \(62.5\)
Urban, No Pet: \(37.5\)
Rural, Own Pet: \(87.5\)
Rural, No Pet: \(52.5\)
Step 2: Compute each contribution.
\(\dfrac{(60-62.5)^2}{62.5}=0.10\)
\(\dfrac{(40-37.5)^2}{37.5}=0.17\)
\(\dfrac{(90-87.5)^2}{87.5}=0.07\)
\(\dfrac{(30-32.5)^2}{32.5}=0.19\)
Step 3: Add the contributions.
\(\chi^2=0.10+0.17+0.07+0.19=0.53\)
Answer:
The chi-square test statistic is approximately
\(\boxed{\chi^2=0.53}\)
3.15.B.2 Finding the p-value for a Chi-Square Test
After calculating the chi-square test statistic (\(\chi^2\)), the next step is to determine the p-value.
The p-value is the probability of obtaining a chi-square statistic that is at least as large as the observed value, assuming the null hypothesis is true.
Because the chi-square distribution is right-skewed, the p-value is always found using the right tail of the chi-square distribution.
On the AP Statistics Exam, the p-value may be found using: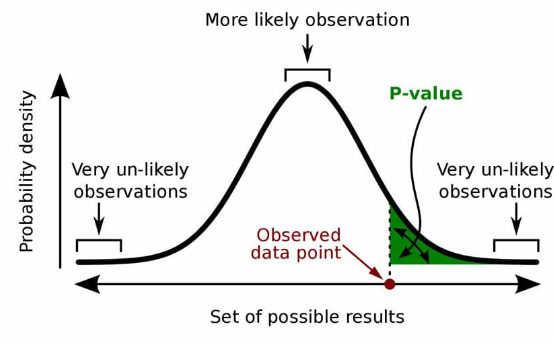
- A chi-square distribution table.
- A graphing calculator.
- Statistical software or other approved technology.
Finding the p-value
To determine the p-value, you need:
- The chi-square test statistic (\(\chi^2\)).
- The degrees of freedom (df).
The degrees of freedom are calculated as
\(\text{df}=(\text{Number of Rows}-1)(\text{Number of Columns}-1)\)
Then find
\(P(\chi^2\ge\text{observed }\chi^2)\)
Example 1
A chi-square test produces
\(\chi^2=5.84,\qquad df=2\)
Using technology, the p-value is
\(p\text{-value}=0.054\)
Interpretation:
Assuming the null hypothesis is true, there is approximately a 5.4% chance of obtaining a chi-square statistic of 5.84 or greater.
Example 2
A chi-square test produces
\(\chi^2=12.76,\qquad df=3\)
Technology reports
\(p\text{-value}=0.0052\)
This small p-value indicates that the observed differences would be unusual if the null hypothesis were true.
Relationship Between the Chi-Square Statistic and the p-value
| Chi-Square Statistic | p-value |
|---|---|
| Small | Large |
| Large | Small |
Important AP Exam Notes
- The p-value for a chi-square test is always found using the right tail of the chi-square distribution.
- You need both the chi-square statistic and the degrees of freedom to determine the p-value.
- Technology is commonly used on the AP Statistics Exam because it provides the exact p-value.
- The p-value is always calculated assuming the null hypothesis is true.
- A larger chi-square statistic generally produces a smaller p-value.
Common AP Exam Mistakes
| Incorrect | Correct |
|---|---|
| Using the left tail of the chi-square distribution. | Always use the right tail. |
| Ignoring the degrees of freedom. | The p-value depends on both \(\chi^2\) and \(df\). |
| Interpreting the p-value without assuming the null hypothesis is true. | The p-value is always computed assuming the null hypothesis is true. |
Example
A researcher wants to determine whether favorite music genre is associated with grade level.
After verifying the conditions, a graphing calculator performs a \(\chi^2\)-Test.
The calculator reports:
- \(\chi^2=8.47\)
- \(df=2\)
- \(p\text{-value}=0.0145\)
Interpret the p-value.
▶️ Answer / Explanation
Assuming that favorite music genre and grade level are independent, there is a 1.45% chance of obtaining a chi-square statistic of 8.47 or greater due to random sampling alone.
Because the p-value is small, the observed differences in the table would be unusual if the null hypothesis were true, providing evidence against the null hypothesis.
3.15.C.1 Interpreting the p-value for a Chi-Square Test
After performing a chi-square test for homogeneity or a chi-square test for independence, the p-value measures how unusual the observed data would be if the null hypothesis were true.
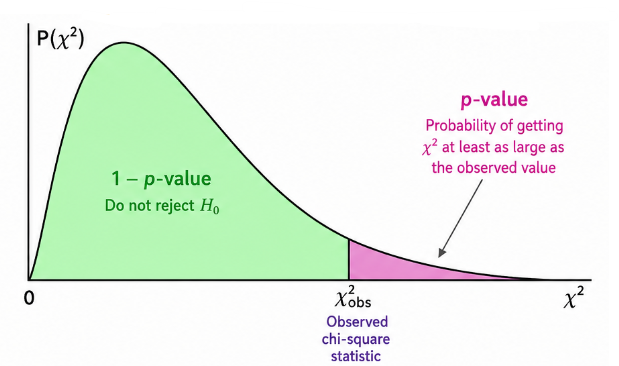
- The p-value is the probability of obtaining a chi-square test statistic as large as or larger than the observed value, assuming the null hypothesis is true.
- The interpretation of the p-value must always begin by stating that it is calculated assuming the null hypothesis is true in the context of the study.
General Interpretation
Assuming the null hypothesis is true, the p-value is the probability of obtaining a chi-square statistic at least as large as the one observed due to random sampling alone.
Example 1: Chi-Square Test for Independence
A researcher investigates whether exercise frequency and sleep quality are associated among adults.
A chi-square test reports
\(p\text{-value}=0.023\)
Interpretation:
Assuming that exercise frequency and sleep quality are independent among adults, there is a 2.3% chance of obtaining a chi-square statistic at least as large as the one observed due to random sampling alone.
Example 2: Chi-Square Test for Homogeneity
A company compares the distribution of preferred smartphone brands among customers from three different cities.
A chi-square test reports
\(p\text{-value}=0.18\)
Interpretation:
Assuming that the distribution of preferred smartphone brands is the same across the three cities, there is an 18% chance of obtaining a chi-square statistic at least as large as the one observed due to random sampling alone.
Interpreting the Size of the p-value
| Size of p-value | Interpretation |
|---|---|
| Small | The observed counts would be unusual if the null hypothesis were true, providing evidence against the null hypothesis. |
| Large | The observed counts are reasonably likely if the null hypothesis is true and do not provide convincing evidence against it. |
Important AP Exam Notes
- The p-value is always calculated assuming the null hypothesis is true.
- For a chi-square test for independence, assume the two categorical variables are independent.
- For a chi-square test for homogeneity, assume the distributions of the categorical variable are the same across all populations.
- The p-value represents the probability of obtaining a chi-square statistic at least as large as the observed value.
- A small p-value provides evidence against the null hypothesis, while a large p-value does not.
- The p-value is not the probability that the null hypothesis is true.
Common AP Exam Mistakes
| Incorrect | Correct |
|---|---|
| The p-value is the probability that the null hypothesis is true. | The p-value is calculated assuming the null hypothesis is true. |
| Failing to interpret the p-value in context. | Reference the variables and population(s) in the study. |
| Describing the p-value as the probability that the alternative hypothesis is correct. | The p-value measures how unusual the observed results are under the null hypothesis. |
Example
A researcher investigates whether favorite school subject is associated with grade level.
A graphing calculator performs a chi-square test for independence and reports:
- \(\chi^2=10.28\)
- \(df=4\)
- \(p\text{-value}=0.036\)
Interpret the p-value in the context of the study.
▶️ Answer / Explanation
Assuming that favorite school subject and grade level are independent for all students at the school, there is a 3.6% chance of obtaining a chi-square statistic of 10.28 or greater due to random sampling alone.
Because the p-value is relatively small, the observed differences would be unusual if the variables were truly independent, providing evidence against the null hypothesis.
3.15.D.1 Making a Formal Decision Using the p-value
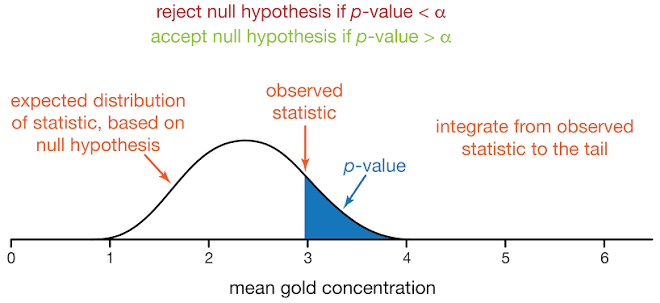
After calculating the p-value for a chi-square test, compare it with the significance level, denoted by \(\alpha\).
The significance level is chosen before the data are analyzed and serves as the cutoff for determining whether the observed results are statistically significant.
Decision Rule
| Comparison | Decision |
|---|---|
| \(p\text{-value}\le\alpha\) | Reject \(H_0\) |
| \(p\text{-value}>\alpha\) | Fail to Reject \(H_0\) |
Example 1
A chi-square test reports
\(p\text{-value}=0.018,\qquad \alpha=0.05\)
Since
\(0.018\le0.05\)
Decision: Reject the null hypothesis.
Example 2
A chi-square test reports
\(p\text{-value}=0.27,\qquad \alpha=0.05\)
Since
\(0.27>0.05\)
Decision: Fail to reject the null hypothesis.
3.15.D.2 Using the Chi-Square Test to Answer an Investigative Question
The purpose of a chi-square test is to answer an investigative question about categorical data.
The conclusion depends on the type of chi-square test that was performed.
- Chi-Square Test for Independence: Answers whether two categorical variables are associated in a single population.
- Chi-Square Test for Homogeneity: Answers whether the distributions of a categorical variable differ across two or more populations.
The results of the hypothesis test provide statistical reasoning for answering the investigative question.
Example (Independence)
Investigative Question:
- “Is favorite school subject associated with grade level?”
- If the null hypothesis is rejected, the investigative question can be answered as:
- “There is convincing statistical evidence that favorite school subject is associated with grade level.”
Example (Homogeneity)
Investigative Question:
- “Do students from three different schools have the same distribution of transportation methods?”
- If the null hypothesis is rejected, the investigative question can be answered as:
- “There is convincing statistical evidence that the distribution of transportation methods differs among the three schools.”
3.15.D.3 Writing a Conclusion in Context
A complete AP Statistics conclusion should:
- Be consistent with the statistical decision.
- Be written in terms of the alternative hypothesis.
- Use non-definitive language, such as “there is convincing statistical evidence” or “there is not convincing statistical evidence.”
- Reference the population(s) and the categorical variable(s) in context.
Recommended AP Exam Wording
| Decision | Appropriate Conclusion |
|---|---|
| Reject \(H_0\) | There is convincing statistical evidence supporting the alternative hypothesis. |
| Fail to Reject \(H_0\) | There is not convincing statistical evidence supporting the alternative hypothesis. |
Examples of Conclusions
Chi-Square Test for Independence
If the null hypothesis is rejected:
There is convincing statistical evidence that exercise frequency and sleep quality are associated for adults in the population.
If the null hypothesis is not rejected:
There is not convincing statistical evidence that exercise frequency and sleep quality are associated for adults in the population.
Chi-Square Test for Homogeneity
If the null hypothesis is rejected:
There is convincing statistical evidence that the distribution of preferred smartphone brands differs among customers from the three cities.
If the null hypothesis is not rejected:
There is not convincing statistical evidence that the distribution of preferred smartphone brands differs among customers from the three cities.
Important AP Exam Notes
- Always compare the p-value with the significance level \(\alpha\).
- If \(p\text{-value}\le\alpha\), reject the null hypothesis.
- If \(p\text{-value}>\alpha\), fail to reject the null hypothesis.
- Answer the original investigative question using the statistical results.
- Write conclusions in terms of the alternative hypothesis.
- Use non-definitive language; never claim that the null hypothesis has been proven.
- Always include the variables and population(s) in the conclusion.
Common AP Exam Mistakes
| Incorrect | Correct |
|---|---|
| Accept the null hypothesis. | Fail to reject the null hypothesis. |
| The variables are independent. | There is not convincing statistical evidence that the variables are associated. |
| The distributions are definitely different. | There is convincing statistical evidence that the distributions differ. |
| Writing conclusions without mentioning the variables or populations. | Always state the variables and population(s) in context. |
Example
A researcher investigates whether favorite social media platform is associated with grade level.
A graphing calculator performs a chi-square test for independence and reports:
- \(p\text{-value}=0.012\)
The significance level is
\(\alpha=0.05\)
Write the statistical decision and the conclusion in context.
▶️ Answer / Explanation
Step 1: Compare the p-value with the significance level.
\(0.012\le0.05\)
Decision:
Reject the null hypothesis.
Conclusion:
There is convincing statistical evidence that favorite social media platform is associated with grade level for students at the school.