
3.3.A.1 Confidence Intervals for a Population Proportion
When the goal is to estimate an unknown population proportion, statisticians use a confidence interval instead of a single point estimate.
A confidence interval is an interval of plausible values for a population parameter based on sample data. Rather than estimating the parameter with one value, it provides a range of values that is likely to contain the true population parameter.
When estimating a single population proportion, the appropriate inference procedure is a one-sample z-interval for a population proportion.
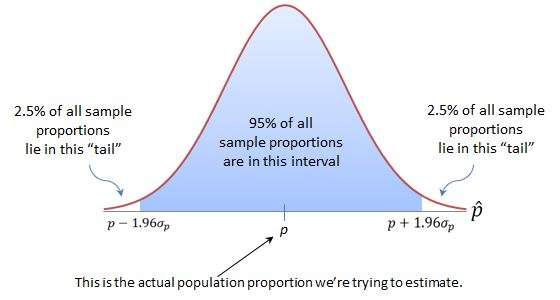
This procedure uses the sample proportion \( \hat{p} \) to estimate the unknown population proportion \( p \).
Appropriate Confidence Interval Procedure
| Situation | Appropriate Procedure |
|---|---|
| Estimate one population proportion | One-Sample z-Interval for a Population Proportion |
When Is This Procedure Used?
- To estimate a single population proportion.
- When the data come from a random sample or a randomized experiment.
- When the required conditions for constructing a confidence interval are satisfied.
Example 1
A polling organization randomly surveys 800 registered voters to estimate the proportion of all registered voters who support a new education policy.
Appropriate Procedure:
Since the goal is to estimate one population proportion, the correct inference procedure is a
One-Sample z-Interval for a Population Proportion.
Example 2
A company randomly selects 300 customers to estimate the proportion of all customers who are satisfied with a new product.
Appropriate Procedure:
The appropriate confidence interval procedure is a
One-Sample z-Interval for a Population Proportion.
3.3.A.2 Identifying the Population Parameter
When stating the parameter for a confidence interval, always describe it in the context of the problem.
The parameter should clearly identify:
- The population being studied.
- The response variable (the characteristic being measured).
- That the parameter is a population proportion \(p\).
Simply writing “\(p\)” is not sufficient on the AP Exam. The parameter must be written as a complete sentence using the context of the problem.
Examples of Correctly Identifying the Parameter
| Context | Population Parameter |
|---|---|
| School survey | \(p\) = the true proportion of all students at the school who participate in at least one extracurricular activity. |
| Election poll | \(p\) = the true proportion of all registered voters who support the proposed candidate. |
| Customer survey | \(p\) = the true proportion of all customers who are satisfied with the product. |
Important AP Exam Notes
- A confidence interval estimates a population parameter, not a sample statistic.
- For one population proportion, use a one-sample z-interval for a population proportion.
- Always identify the parameter in the context of the problem.
- Your parameter statement should include the population, the response variable, and that it is a population proportion \(p\).
- A confidence interval gives a range of plausible values for the true population proportion.
Common AP Exam Mistakes
| Incorrect | Correct |
|---|---|
| Writing only “\(p\)” as the parameter. | Describe the population proportion in context. |
| Using a confidence interval to estimate a sample statistic. | Confidence intervals estimate population parameters. |
| Choosing the wrong inference procedure. | For one population proportion, use a one-sample z-interval. |
Example
A random sample of 500 adults is selected to estimate the proportion of all adults in a state who support expanding public transportation.
Identify the appropriate confidence interval procedure and state the population parameter in context.
▶️ Answer / Explanation
Appropriate Procedure:
A one-sample z-interval for a population proportion should be used because the goal is to estimate one population proportion.
Population Parameter:
\(p\) is the true proportion of all adults in the state who support expanding public transportation.
3.3.C.1 Critical Values and Confidence Levels
A confidence interval is constructed by using a critical value, denoted by \(z^*\), together with the sample statistic.
The critical values \(-z^*\) and \(+z^*\) mark the boundaries of the middle \(C\%\) of the standard Normal distribution.
The value \(C\%\) is called the confidence level. It represents the long-run percentage of confidence intervals, constructed using the same method, that would contain the true population proportion.
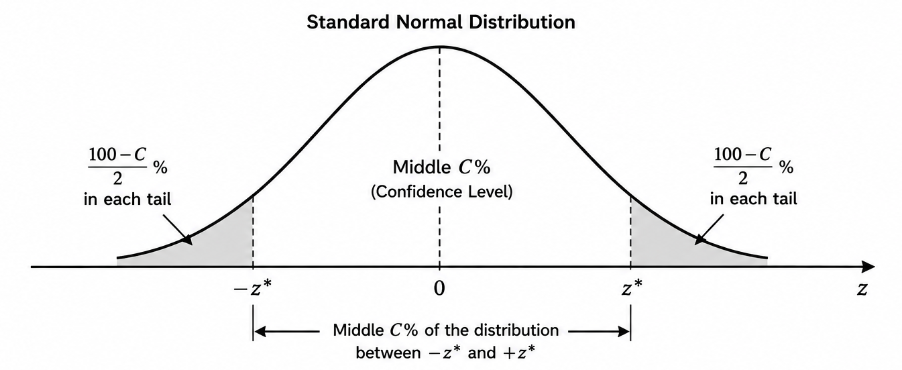
As the confidence level increases, the critical value becomes larger, producing a wider confidence interval.
Common Confidence Levels and Critical Values
| Confidence Level | Critical Value (\(z^*\)) |
|---|---|
| 90% | 1.645 |
| 95% | 1.96 |
| 99% | 2.576 |
Example
A researcher wants to construct a 95% confidence interval for a population proportion.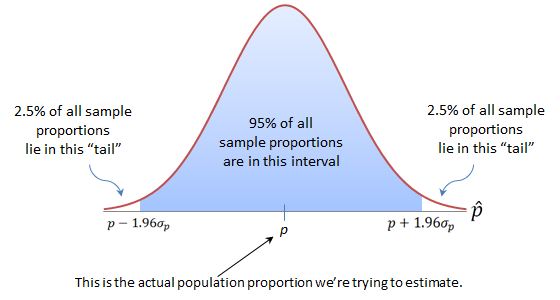
The corresponding critical value is
\(z^*=1.96\)
This means the middle 95% of the standard Normal distribution lies between
\(-1.96\) and \(+1.96\)
Important AP Exam Notes
- \(z^*\) depends only on the chosen confidence level.
- Higher confidence levels require larger critical values.
- Larger critical values produce wider confidence intervals.
- The confidence level describes the success rate of the interval-producing method, not the probability that a specific interval contains the parameter.
3.3.C.2 Constructing a One-Sample z-Interval for a Population Proportion
After verifying that all conditions are satisfied, a confidence interval can be calculated using the point estimate ± margin of error form.
The point estimate is the sample proportion \( \hat{p} \).
The margin of error measures the maximum expected difference between the sample proportion and the true population proportion for the chosen confidence level.
Confidence Interval Formula
\( \hat{p}\pm z^*\sqrt{\dfrac{\hat{p}(1-\hat{p})}{n}} \)
Where:
- \(\hat{p}\) = Sample proportion (point estimate)
- \(z^*\) = Critical value corresponding to the confidence level
- \(n\) = Sample size
- \(\sqrt{\dfrac{\hat{p}(1-\hat{p})}{n}}\) = Standard error of the sample proportion
- Margin of Error = \(z^*\times\sqrt{\dfrac{\hat{p}(1-\hat{p})}{n}}\)
Confidence Interval Structure
| Component | Meaning |
|---|---|
| Point Estimate | The sample proportion \( \hat{p} \). |
| Margin of Error | Amount added to and subtracted from the point estimate. |
| Confidence Interval | Range of plausible values for the population proportion. |
Example
A random sample of 400 voters is selected.
Of those surveyed, 240 support a proposed law.
Construct a 95% confidence interval for the population proportion.
Step 1: Calculate the sample proportion.
\( \hat{p}=\dfrac{240}{400}=0.60 \)
Step 2: Identify the critical value.
\(z^*=1.96\)
Step 3: Calculate the standard error.
\( \sqrt{\dfrac{0.60(0.40)}{400}}=\sqrt{0.0006}\approx0.0245 \)
Step 4: Calculate the margin of error.
\(1.96(0.0245)\approx0.048\)
Step 5: Construct the confidence interval.
\(0.60\pm0.048\)
\((0.552,\;0.648)\)
Interpretation:
We are 95% confident that the true proportion of all voters who support the proposed law is between 0.552 and 0.648.
Important AP Exam Notes
- Every confidence interval follows the form point estimate ± margin of error.
- Use the sample proportion \( \hat{p} \) when calculating the standard error.
- Increasing the confidence level increases the margin of error and widens the interval.
- Increasing the sample size decreases the standard error and produces a narrower interval.
- Always interpret the confidence interval in the context of the population.
Common AP Exam Mistakes
| Incorrect | Correct |
|---|---|
| Using \(p\) instead of \(\hat{p}\) in the standard error. | Use the sample proportion \(\hat{p}\). |
| Using the wrong critical value. | Choose \(z^*\) based on the confidence level. |
| Saying there is a 95% probability the parameter is in the interval. | State that you are 95% confident the interval contains the true population proportion. |
Example
A random sample of 500 college students is selected, and 315 report owning a tablet.
Construct and interpret a 95% confidence interval for the population proportion of all college students who own a tablet.
▶️ Answer / Explanation
Step 1:
\( \hat{p}=\dfrac{315}{500}=0.63 \)
Step 2:
\(z^*=1.96\)
Step 3:
\(SE=\sqrt{\dfrac{0.63(0.37)}{500}}\approx0.0216\)
Step 4:
\(ME=1.96(0.0216)\approx0.042\)
Step 5:
\(0.63\pm0.042=(0.588,\;0.672)\)
Interpretation:
We are 95% confident that the true proportion of all college students who own a tablet is between 0.588 and 0.672.
3.3.D.1 Standard Error of a Sample Proportion
When constructing a confidence interval, the standard error (SE) measures the expected variability of the sample proportion from sample to sample.
The standard error is an estimate of the standard deviation of the sampling distribution because the true population proportion is usually unknown.
A smaller standard error means that sample proportions tend to be closer to the true population proportion, resulting in a more precise estimate.
Formula for the Standard Error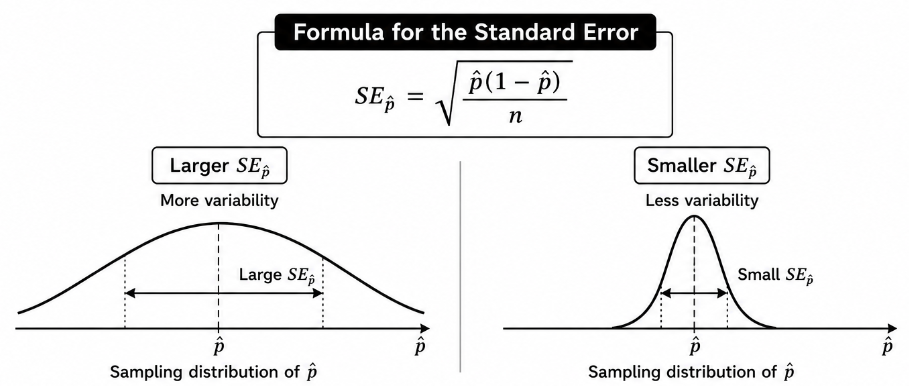
\(SE_{\hat{p}}=\sqrt{\dfrac{\hat{p}(1-\hat{p})}{n}}\)
Where:
- \(\hat{p}\) = Sample proportion
- \(n\) = Sample size
- \(SE_{\hat{p}}\) = Standard error of the sample proportion
Example 1
A random sample of 400 students is selected.
Among them, 260 own a laptop.
Step 1: Calculate the sample proportion.
\( \hat{p}=\dfrac{260}{400}=0.65 \)
Step 2: Calculate the standard error.
\(SE_{\hat{p}}=\sqrt{\dfrac{0.65(0.35)}{400}}\)
\(=\sqrt{0.00056875}\approx0.0238\)
Conclusion:
The estimated standard deviation of the sampling distribution is approximately 0.0238.
3.3.D.2 Interpreting the Standard Error
The standard error describes the typical amount by which the sample statistic differs from the corresponding population parameter due to random sampling.
For a sample proportion, it measures the typical distance between the sample proportion \( \hat{p} \) and the true population proportion \( p \).
- A small standard error indicates that repeated random samples are likely to produce sample proportions that are close to the population proportion.
- A large standard error indicates greater sample-to-sample variability.
Factors Affecting the Standard Error
| Factor | Effect on Standard Error |
|---|---|
| Increase the sample size \(n\) | Standard error decreases. |
| Decrease the sample size \(n\) | Standard error increases. |
| Smaller standard error | More precise estimates. |
| Larger standard error | Less precise estimates. |
Example 2
Suppose the standard error of the sample proportion is
\(SE_{\hat{p}}=0.018\)
Interpretation:
The sample proportions from repeated random samples are expected to differ from the true population proportion by about 0.018, on average, due to random sampling.
Important AP Exam Notes
- The standard error estimates the standard deviation of the sampling distribution.
- Use the sample proportion \(\hat{p}\) when calculating the standard error for a confidence interval.
- A smaller standard error indicates a more precise estimate of the population proportion.
- Increasing the sample size decreases the standard error.
- The standard error describes the variability of the sample statistic, not individual observations.
Common AP Exam Mistakes
| Incorrect | Correct |
|---|---|
| Using the population proportion \(p\). | Use the sample proportion \(\hat{p}\) when calculating the standard error for a confidence interval. |
| Confusing standard error with standard deviation. | Standard error estimates the standard deviation of the sampling distribution. |
| Saying the standard error measures the spread of individual observations. | It measures the variability of the sample statistic. |
Example
A random sample of 500 households is selected.
Among them, 320 recycle regularly.
Calculate the standard error of the sample proportion and interpret its meaning.
▶️ Answer / Explanation
Step 1: Calculate the sample proportion.
\( \hat{p}=\dfrac{320}{500}=0.64 \)
Step 2: Calculate the standard error.
\(SE_{\hat{p}}=\sqrt{\dfrac{0.64(0.36)}{500}}\)
\(=\sqrt{0.0004608}\approx0.0215\)
Interpretation:
The sample proportions from repeated random samples of 500 households would typically differ from the true population proportion of households that recycle regularly by about 0.0215.
3.3.D.3 Margin of Error for a Confidence Interval
The margin of error (MOE) measures the maximum expected difference between the sample proportion and the true population proportion for a given confidence level.
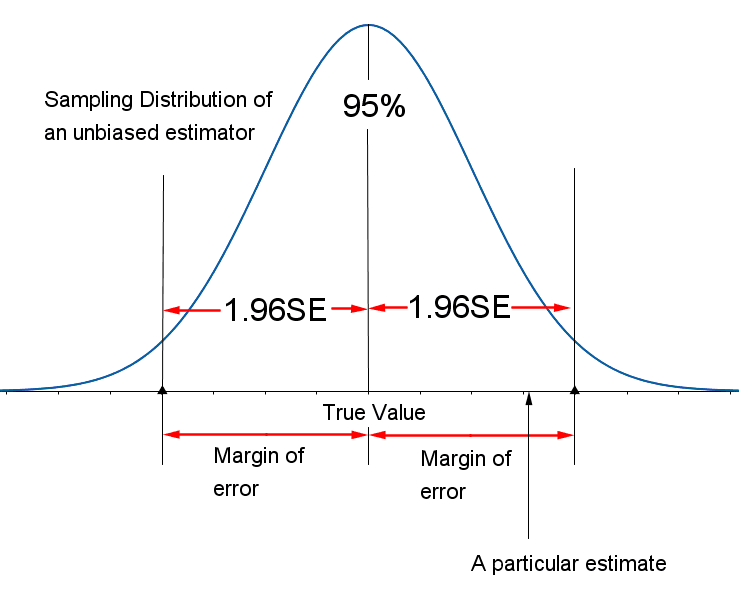
It determines how far the confidence interval extends above and below the sample proportion.
- The margin of error is always half the width of the confidence interval.
- A larger margin of error produces a wider confidence interval, while a smaller margin of error produces a narrower confidence interval.
Formula for Margin of Error
\(MOE=z^*\sqrt{\dfrac{\hat{p}(1-\hat{p})}{n}}\)
Where:
- \(MOE\) = Margin of error
- \(z^*\) = Critical value for the selected confidence level
- \(\hat{p}\) = Sample proportion
- \(n\) = Sample size
Relationship Between the Confidence Interval and Margin of Error
| Quantity | Formula |
|---|---|
| Confidence Interval | \( \hat{p}\pm MOE \) |
| Margin of Error | Half the width of the confidence interval |
| Width of Confidence Interval | \(2(MOE)\) |
Example 1
A random sample of 500 voters is selected.
The sample proportion supporting a new law is
\( \hat{p}=0.58 \)
A 95% confidence interval is desired.
Step 1: Use the critical value.
\(z^*=1.96\)
Step 2: Calculate the margin of error.
\(MOE=1.96\sqrt{\dfrac{0.58(0.42)}{500}}\)
\(\approx1.96(0.0221)\approx0.043\)
Conclusion:
The confidence interval extends approximately 0.043 above and below the sample proportion.
3.3.D.4 Determining the Required Sample Size
Sometimes researchers decide on a desired margin of error before collecting data.
The margin of error formula can be rearranged to determine the minimum sample size needed to achieve that level of precision.
Required Sample Size Formula
\(n=\dfrac{(z^*)^2\hat{p}(1-\hat{p})}{(MOE)^2}\)
Where:
- \(n\) = Minimum required sample size
- \(z^*\) = Critical value
- \(\hat{p}\) = Estimated sample proportion
- \(MOE\) = Desired margin of error
If no previous estimate of the population proportion is available, use
\(\hat{p}=0.50\)
This produces the largest possible sample size, ensuring that the desired margin of error will be achieved regardless of the true population proportion.
Example 2
A researcher wants to estimate a population proportion with a 95% confidence level and a margin of error of 0.03.
No previous estimate of the population proportion is available.
Step 1: Use
\(z^*=1.96\)
and
\(\hat{p}=0.50\)
Step 2: Substitute into the formula.
\(n=\dfrac{(1.96)^2(0.50)(0.50)}{(0.03)^2}\)
\(=\dfrac{3.8416(0.25)}{0.0009}\approx1067.1\)
Step 3: Round up.
\(n=1068\)
Conclusion:
At least 1,068 individuals should be sampled.
Important AP Exam Notes
- The margin of error is always half the width of a confidence interval.
- Increasing the confidence level increases the margin of error.
- Increasing the sample size decreases the margin of error.
- When calculating the required sample size, always round up to the next whole number.
- If no estimate of the population proportion is available, use \(\hat{p}=0.50\).
Common AP Exam Mistakes
| Incorrect | Correct |
|---|---|
| Using the full width of the confidence interval as the margin of error. | The margin of error is one-half of the interval width. |
| Rounding the required sample size down. | Always round the required sample size up. |
| Using an arbitrary value for \(\hat{p}\) when no estimate is available. | Use \(\hat{p}=0.50\) to obtain the maximum required sample size. |
Example
A researcher wants to estimate the proportion of households that own an electric vehicle.
She would like a 95% confidence interval with a margin of error of 0.04.
No previous estimate of the population proportion is available.
Determine the minimum sample size required.
▶️ Answer / Explanation
Step 1: Since no estimate is available, use
\(\hat{p}=0.50\)
Step 2: Use
\(z^*=1.96\)
Step 3: Calculate the sample size.
\(n=\dfrac{(1.96)^2(0.50)(0.50)}{(0.04)^2}\)
\(=\dfrac{3.8416(0.25)}{0.0016}=600.25\)
Step 4: Round up.
\(n=601\)
Answer:
A minimum sample size of 601 households is required.