
3.4.A.1 Interpreting Whether a Confidence Interval Contains the Population Proportion
A confidence interval is calculated using data from a sample, not the entire population.
- Because different random samples produce different confidence intervals, a confidence interval may or may not contain the true population proportion.
- Once a confidence interval has been calculated, the true population proportion either is inside the interval or is not. There is no way to know for certain unless the actual population proportion is known.
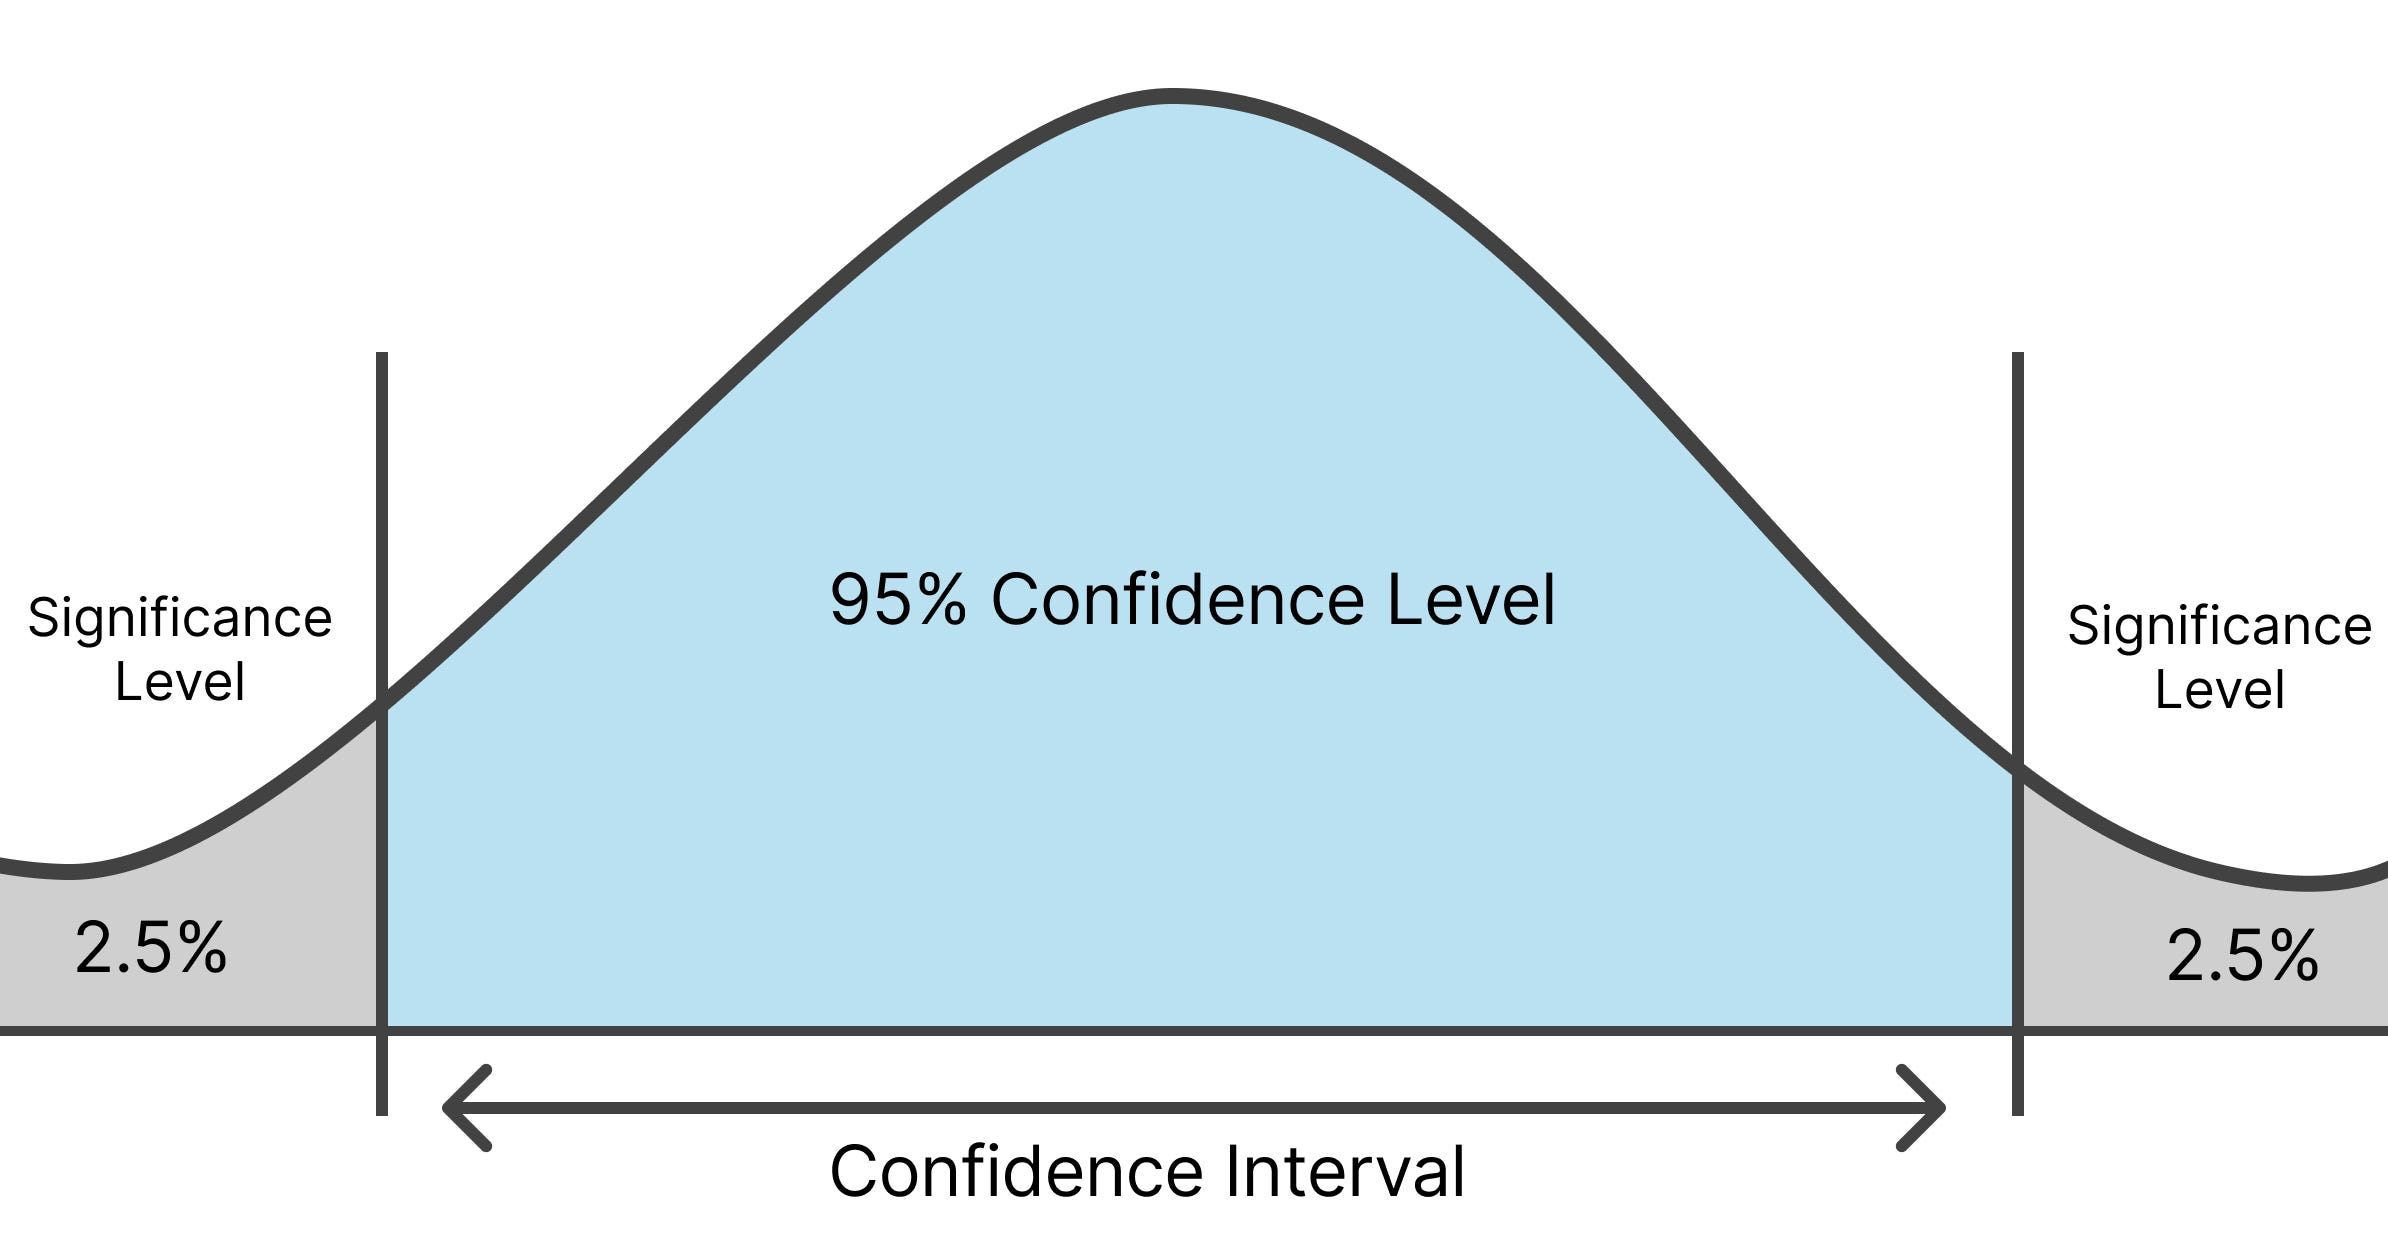
The purpose of a confidence interval is to provide a range of plausible values for the unknown population proportion.
Although one particular confidence interval may miss the true parameter, the confidence interval procedure is designed so that, in the long run, most intervals constructed using the same method will contain the true population proportion.
Possible Outcomes of a Confidence Interval
| Confidence Interval | Contains the True Population Proportion? |
|---|---|
| Interval A | Yes |
| Interval B | No |
| Interval C | Yes |
This illustrates that individual confidence intervals are not guaranteed to contain the true population proportion.
Example 1
A random sample is used to estimate the proportion of adults who exercise at least three times per week.
A 95% confidence interval is calculated as
\((0.46,\;0.54)\)
Interpretation:
This interval was calculated from one random sample. The true population proportion may or may not lie between 0.46 and 0.54.
Without knowing the true population proportion, it is impossible to determine whether this specific interval captures it.
Example 2
Suppose another random sample from the same population produces the interval
\((0.43,\;0.51)\)
This second interval is different because a different random sample was selected.
Like the first interval, it may or may not contain the true population proportion.
Important AP Exam Notes
- A confidence interval is calculated from sample data, so it is only an estimate of the population parameter.
- Different random samples produce different confidence intervals.
- A specific confidence interval either contains the true population proportion or it does not.
- It is impossible to know whether a particular interval captures the parameter unless the true population proportion is known.
- Confidence intervals provide a range of plausible values for the unknown population proportion.
Common AP Exam Mistakes
| Incorrect | Correct |
|---|---|
| Every confidence interval contains the true population proportion. | A confidence interval may or may not contain the true population proportion. |
| Different samples always produce the same confidence interval. | Different random samples usually produce different confidence intervals. |
| The interval proves the true population proportion is inside it. | The interval provides a plausible range, but whether it actually contains the parameter is unknown. |
Example
A researcher constructs a 95% confidence interval of
\((0.58,\;0.66)\)
for the proportion of all households in a city that have internet access.
Explain whether this interval definitely contains the true population proportion.
▶️ Answer / Explanation
Answer:
No.
Explanation:
The confidence interval was calculated from a sample, so it is only an estimate of the population proportion.
This particular interval may or may not contain the true proportion of all households in the city with internet access.
Without knowing the actual population proportion, it is impossible to determine whether this specific interval captures the true value.
3.4.A.2 Interpreting the Confidence Level
The confidence level describes the long-run success rate of the method used to construct confidence intervals.
If the same sampling method is repeated many times using the same sample size, and a confidence interval is calculated from each sample, then approximately \(C\%\) of those confidence intervals will contain the true population proportion.
For example, if a 95% confidence level is used, then about 95% of all confidence intervals constructed using this procedure will successfully capture the true population proportion, while about 5% will not.
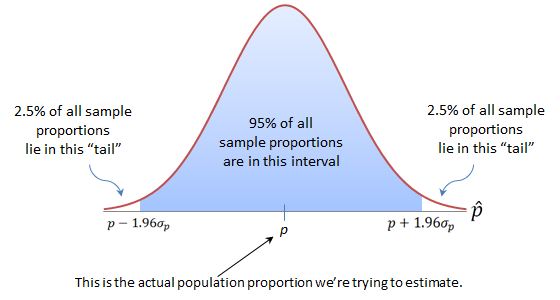
Notice that the confidence level describes the performance of the interval-producing method, not the probability that one specific confidence interval contains the parameter.
Long-Run Interpretation of Confidence Levels
| Confidence Level | Long-Run Interpretation |
|---|---|
| 90% | Approximately 90% of confidence intervals from repeated random samples will contain the true population proportion. |
| 95% | Approximately 95% of confidence intervals from repeated random samples will contain the true population proportion. |
| 99% | Approximately 99% of confidence intervals from repeated random samples will contain the true population proportion. |
Example 1
A researcher repeatedly selects random samples of 300 adults and constructs a 95% confidence interval for the proportion of adults who exercise regularly.
Interpretation:
If this sampling process were repeated many times, approximately 95% of the confidence intervals constructed would contain the true proportion of all adults who exercise regularly.
About 5% of the intervals would fail to capture the true population proportion.
Example 2
A survey uses a 90% confidence level to estimate the proportion of households that own a pet.
Interpretation:
If many random samples of the same size were taken and a 90% confidence interval were constructed from each sample, approximately 90% of those intervals would contain the true population proportion of households that own a pet.
Important AP Exam Notes
- The confidence level refers to the long-run success rate of the confidence interval procedure.
- Repeated random sampling must use the same sample size and the same confidence interval method.
- A 95% confidence level means that approximately 95% of the intervals, not 95% of the sample statistics, will capture the true population proportion.
- Higher confidence levels produce a greater percentage of intervals that capture the parameter, but they also produce wider confidence intervals.
- The confidence level is about the method, not a single interval.
Common AP Exam Mistakes
| Incorrect | Correct |
|---|---|
| A 95% confidence level means there is a 95% chance this interval contains the parameter. | A 95% confidence level means about 95% of intervals from repeated random samples will contain the parameter. |
| 95% of the sample proportions are correct. | Approximately 95% of the confidence intervals capture the true population proportion. |
| The confidence level applies only to one sample. | The confidence level describes what happens over many repeated random samples. |
Example
A statistician repeatedly selects random samples of 500 registered voters and constructs a 99% confidence interval for the proportion who support a proposed amendment.
Interpret the meaning of the 99% confidence level.
▶️ Answer / Explanation
Answer:
If many random samples of 500 registered voters are selected and a 99% confidence interval is constructed from each sample, then approximately 99% of those confidence intervals will contain the true proportion of all registered voters who support the proposed amendment.
Approximately 1% of the intervals will not contain the true population proportion.
3.4.A.3 Interpreting a Confidence Interval in Context
After constructing a confidence interval, the final step is to interpret the interval in the context of the problem.
A correct interpretation must include: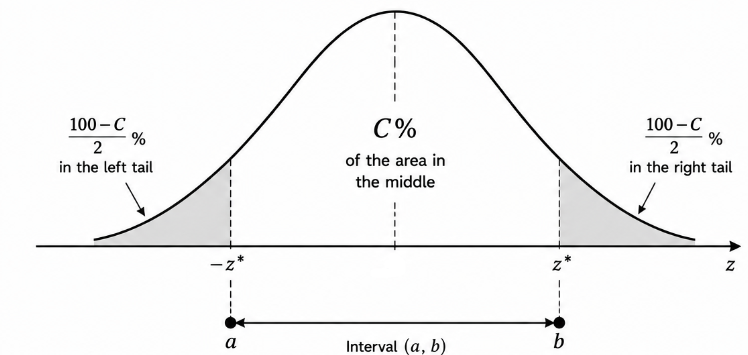
- The confidence level.
- The population parameter being estimated.
- The population being studied.
- The response variable.
- The lower and upper limits of the confidence interval.
The correct interpretation follows this general format:
We are \(C\%\) confident that the interval \((a,\;b)\) contains the true population proportion \(p\).
Here,
- \(C\) = Confidence level
- \(a\) = Lower endpoint of the confidence interval
- \(b\) = Upper endpoint of the confidence interval
The statement should always be written using the context of the study rather than simply referring to “\(p\).”
Correct vs. Incorrect Interpretations
| Incorrect | Correct |
|---|---|
| We are 95% confident that \(p\) is between 0.42 and 0.50. | We are 95% confident that the true proportion of all registered voters who support the proposal is between 0.42 and 0.50. |
| There is a 95% probability that the true proportion is inside the interval. | We are 95% confident that the interval contains the true population proportion. |
Example 1
A 95% confidence interval for the proportion of all high school students who own a laptop is
\((0.72,\;0.80)\)
Correct Interpretation:
We are 95% confident that the true proportion of all high school students who own a laptop is between 0.72 and 0.80.
Example 2
A 99% confidence interval for the proportion of households in a city that recycle is
\((0.61,\;0.69)\)
Correct Interpretation:
We are 99% confident that the true proportion of all households in the city that recycle is between 0.61 and 0.69.
Important AP Exam Notes
- Always include the confidence level in your interpretation.
- Always identify the population parameter in context.
- Include the population and the response variable.
- State both endpoints of the confidence interval.
- Use the phrase “We are \(C\%\) confident…” when interpreting a confidence interval.
Common AP Exam Mistakes
| Incorrect | Correct |
|---|---|
| There is a 95% probability the true proportion is in this interval. | We are 95% confident that the interval contains the true population proportion. |
| Failing to describe the population in context. | Clearly identify the population being studied. |
| Reporting only the interval without interpreting it. | Write a complete interpretation using the confidence level, parameter, population, and interval endpoints. |
AP Exam Example
A survey of 600 college students produced a 95% confidence interval of
\((0.54,\;0.62)\)
for the proportion of all college students who use public transportation to travel to campus.
Interpret this confidence interval.
▶️ Answer / Explanation
Answer:
We are 95% confident that the true proportion of all college students who use public transportation to travel to campus is between 0.54 and 0.62.
This interpretation identifies the confidence level, the population parameter, the population, the response variable, and both endpoints of the confidence interval.
3.4.C.1 Relationship Between Confidence Level, Critical Value, Margin of Error, and Confidence Interval Width
When the sample size remains the same, changing the confidence level affects the critical value, the margin of error, and the width of the confidence interval.
A higher confidence level means we want to be more confident that the interval contains the true population proportion. To achieve this, the interval must become wider.
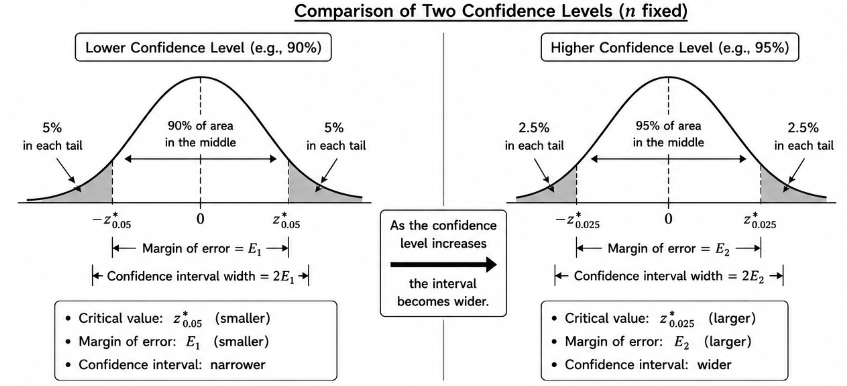
As a result:
- The critical value (\(z^*\)) increases.
- The margin of error increases.
- The confidence interval becomes wider.
Conversely, lowering the confidence level decreases the critical value, decreases the margin of error, and produces a narrower confidence interval.
Effect of Changing the Confidence Level
| If the Confidence Level… | Critical Value (\(z^*\)) | Margin of Error | Confidence Interval Width |
|---|---|---|---|
| Increases | Increases | Increases | Increases |
| Decreases | Decreases | Decreases | Decreases |
Example 1
A researcher changes the confidence level from 90% to 99% while keeping the sample size the same.
Result:
- The critical value increases from approximately 1.645 to 2.576.
- The margin of error becomes larger.
- The confidence interval becomes wider.
3.4.C.2 Relationship Between Sample Size, Standard Error, Margin of Error, and Confidence Interval Width
When the confidence level remains the same, changing the sample size affects the standard error and, therefore, the width of the confidence interval.
- Increasing the sample size decreases the standard error, making the estimate more precise.
- As the standard error decreases, the margin of error also decreases, resulting in a narrower confidence interval.
For a confidence interval for a population proportion, the interval width is approximately proportional to
\(\dfrac{1}{\sqrt{n}}\)
This means that increasing the sample size reduces the width of the confidence interval, but the reduction becomes smaller as the sample size gets larger.
Effect of Changing the Sample Size
| If the Sample Size… | Standard Error | Margin of Error | Confidence Interval Width |
|---|---|---|---|
| Increases | Decreases | Decreases | Decreases |
| Decreases | Increases | Increases | Increases |
Example 2
A survey increases its sample size from 200 to 800 while keeping the confidence level at 95%.
Result:
- The standard error decreases.
- The margin of error decreases.
- The confidence interval becomes narrower.
- The estimate of the population proportion becomes more precise.
Important AP Exam Notes
- Increasing the confidence level increases the critical value, the margin of error, and the confidence interval width.
- Increasing the sample size decreases the standard error, the margin of error, and the confidence interval width.
- A wider confidence interval provides more confidence but less precision.
- A narrower confidence interval provides greater precision but requires either a larger sample size or a lower confidence level.
- For a fixed confidence level, the interval width is approximately proportional to \( \dfrac{1}{\sqrt{n}} \).
Common AP Exam Mistakes
| Incorrect | Correct |
|---|---|
| Increasing the confidence level makes the interval narrower. | Increasing the confidence level makes the interval wider. |
| Increasing the sample size increases the margin of error. | Increasing the sample size decreases the margin of error. |
| The confidence interval width is proportional to \(n\). | The confidence interval width is approximately proportional to \( \dfrac{1}{\sqrt{n}} \). |
Example
A researcher currently uses a 95% confidence interval based on a sample of 400 individuals.
Answer the following:
- What happens to the confidence interval if the confidence level is increased to 99% while the sample size stays the same?
- What happens to the confidence interval if the sample size is increased to 1,600 while the confidence level remains at 95%?
▶️ Answer / Explanation
Part 1:
- The critical value increases.
- The margin of error increases.
- The confidence interval becomes wider.
Part 2:
- The standard error decreases.
- The margin of error decreases.
- The confidence interval becomes narrower.
- The estimate becomes more precise.