Identify Potential Sources of Bias in Sampling Methods
Bias occurs when a sampling method systematically favors certain outcomes. A biased sample is not representative of the population and leads to unreliable conclusions. Recognizing sources of bias helps us avoid poor sampling methods.
Common Sources of Bias: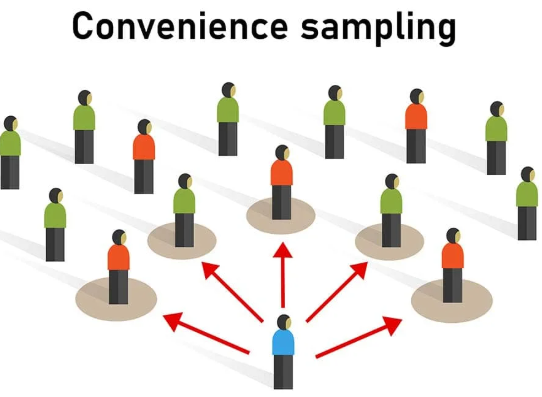
Convenience Bias:
- Occurs when samples are taken from individuals who are easiest to reach.
- Quick and inexpensive, but usually unrepresentative of the population.
- Tends to overrepresent certain groups (like people nearby or available).
- Leads to inaccurate generalizations.
- Common in everyday surveys, but not reliable for inference.
Voluntary Response Bias:
- Occurs when individuals choose whether or not to respond.
- Respondents often have stronger opinions than nonrespondents.
- Overrepresents people with extreme views.
- Underrepresents people who are indifferent or less motivated.
- Frequently seen in online polls and call-in surveys.
Undercoverage: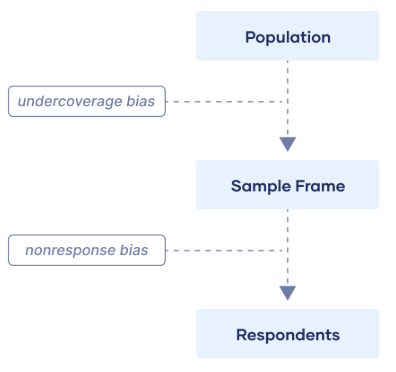
- Happens when some groups in the population are not included in the sampling frame.
- Causes certain groups to be systematically left out.
- For example, phone surveys miss those without phones.
- Results in biased estimates if excluded groups differ from included ones.
- Common in surveys relying on outdated or incomplete lists.
Nonresponse:
- Occurs when selected individuals do not respond to the survey.
- Problematic if nonresponders differ significantly from responders.
- Even random samples can suffer from nonresponse bias.
- High nonresponse rates reduce reliability of results.
- Follow-ups (reminders, incentives) may reduce this bias.
Response Bias:
- Happens when participants give inaccurate or false answers.
- Can be caused by poorly worded or leading questions.
- May result from social desirability (people answer in ways they think are acceptable).
- Interviewer’s tone, presence, or phrasing can influence answers.
- Common in surveys about sensitive topics (drugs, income, politics).
Comparison Table
| Type of Bias | Description | Example |
|---|---|---|
| Convenience Bias | Sample chosen from individuals easy to reach | Surveying only friends about school lunches |
| Voluntary Response Bias | Individuals self-select into the sample | Online poll where only interested people respond |
| Undercoverage | Some groups not included in the sample | Phone survey excluding those without phones |
| Nonresponse | Chosen individuals do not participate | Mailed surveys where many ignore the questionnaire |
| Response Bias | Inaccurate or misleading answers are given | Students underreporting alcohol use in a survey |
Example
A news website posts a poll asking readers if they support a new tax. Thousands respond, but participation is voluntary.
What type of bias is present?
▶️ Answer / Explanation
Step 1: Respondents chose to participate.
Step 2: People with strong opinions are more likely to respond than neutral individuals.
Conclusion: This is voluntary response bias.
Example
A researcher surveys people at a shopping mall to estimate average household income in the city.
What type of bias is present?
▶️ Answer / Explanation
Step 1: The sample only includes people who go to that mall.
Step 2: Groups who do not shop at malls are excluded.
Conclusion: This is undercoverage bias.
Example
A school emails a survey to parents about cafeteria quality, but only 40% reply.
What type of bias is present?
▶️ Answer / Explanation
Step 1: A significant portion of the selected sample did not respond.
Step 2: Non-responders may have different opinions than responders.
Conclusion: This is nonresponse bias.