
3.5.A.1 Identifying the Appropriate Hypothesis Test for a Population Proportion
When the goal is to determine whether there is convincing statistical evidence about the value of a population proportion, a hypothesis test is used.
- A hypothesis test is a statistical inference procedure that uses sample data to make a decision about a population parameter.
- When testing a claim about one population proportion, the appropriate inference procedure is a one-sample z-test for a population proportion.
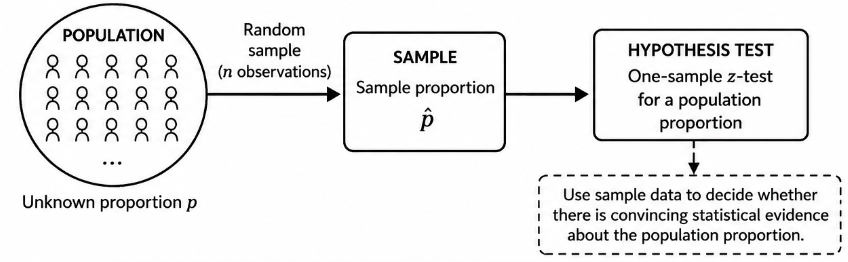
This procedure compares the observed sample proportion with the claimed population proportion to determine whether the difference is likely due to random sampling or provides convincing evidence against the claim.
Appropriate Hypothesis Testing Procedure
| Situation | Appropriate Procedure |
|---|---|
| Test one population proportion | One-Sample z-Test for a Population Proportion |
When Is This Procedure Used?
- To test a claim about a single population proportion.
- When the data come from a random sample or a randomized experiment.
- When the required conditions for a one-sample z-test are satisfied.
Example 1
A nutrition company claims that 70% of adults eat breakfast every day.
A random sample of adults is selected to determine whether the true proportion differs from 70%.
Appropriate Procedure:
One-Sample z-Test for a Population Proportion
Example 2
A school wants to determine whether the proportion of students who participate in after-school activities is greater than 60%.
A random sample of students is selected.
Appropriate Procedure:
One-Sample z-Test for a Population Proportion
3.5.A.2 Identifying the Population Parameter
Before performing a hypothesis test, the population parameter being tested must be clearly identified.
The parameter should include:
- The population being studied.
- The response variable (the characteristic of interest).
- That the parameter is the population proportion \(p\).
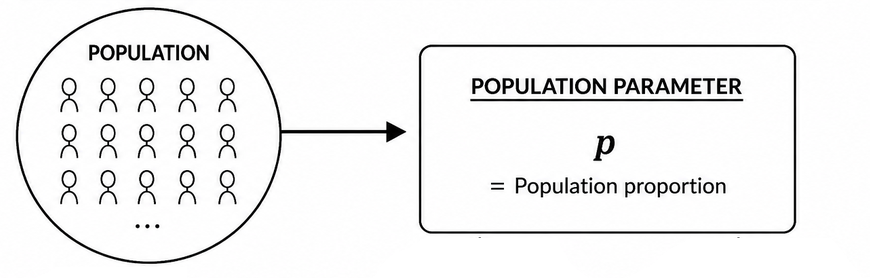
Simply writing \(p\) is not sufficient. On the AP Exam, the parameter must always be stated in the context of the problem.
Examples of Population Parameters
| Context | Population Parameter |
|---|---|
| School survey | \(p\) = the true proportion of all students at the school who participate in at least one extracurricular activity. |
| Election poll | \(p\) = the true proportion of all registered voters who support the proposed candidate. |
| Customer survey | \(p\) = the true proportion of all customers who are satisfied with the company’s service. |
Important AP Exam Notes
- A hypothesis test is used to make a decision about a population parameter, not a sample statistic.
- For one population proportion, the correct inference procedure is a one-sample z-test for a population proportion.
- Always identify the population parameter in context.
- Your parameter statement should include the population, the response variable, and that it is a population proportion \(p\).
- The hypothesis test evaluates whether the sample data provide convincing evidence about the claimed value of the population proportion.
Common AP Exam Mistakes
| Incorrect | Correct |
|---|---|
| Writing only “\(p\)” as the parameter. | Describe the population proportion in context. |
| Using a confidence interval procedure instead of a hypothesis test. | Use a one-sample z-test when testing a claim about one population proportion. |
| Describing the sample instead of the population. | The parameter must refer to the entire population. |
Example
A company claims that 80% of its customers are satisfied with its delivery service.
A random sample of customers is selected to test this claim.
Identify the appropriate hypothesis testing procedure and state the population parameter in context.
▶️ Answer / Explanation
Appropriate Procedure:
A one-sample z-test for a population proportion should be used because the goal is to test a claim about one population proportion.
Population Parameter:
\(p\) is the true proportion of all customers of the company who are satisfied with the company’s delivery service.
3.5.B.1 Null and Alternative Hypotheses for a Population Proportion
Every hypothesis test begins by stating two competing hypotheses about the population proportion.
- The null hypothesis, denoted by \(H_0\), is the statement that is assumed to be true unless the sample data provide convincing evidence otherwise. It represents the status quo, the current belief, or the claim being tested.
- The alternative hypothesis, denoted by \(H_a\), is the statement for which evidence is being collected. It represents the researcher’s claim or the belief that differs from the null hypothesis.
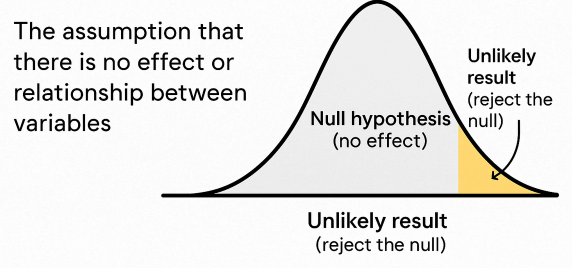
During a hypothesis test, the sample data are used to determine whether there is sufficient evidence to reject the null hypothesis in favor of the alternative hypothesis.
Roles of the Two Hypotheses
| Hypothesis | Purpose |
|---|---|
| Null Hypothesis (\(H_0\)) | Represents the status quo or current claim. It is assumed to be true unless there is convincing statistical evidence against it. |
| Alternative Hypothesis (\(H_a\)) | Represents the researcher’s claim or the statement for which evidence is being collected. |
Example 1
A company claims that 75% of its customers are satisfied with its service.
A researcher believes the actual satisfaction rate is different from 75%.
Interpretation:
- The company’s claim represents the null hypothesis.
- The researcher’s belief represents the alternative hypothesis.
Example 2
A school believes that 60% of students participate in extracurricular activities.
A principal wants to investigate whether participation has increased.
Interpretation:
- The current belief (60%) is the null hypothesis.
- The claim that participation has increased is the alternative hypothesis.
Important AP Exam Notes
- The null hypothesis represents the status quo or current belief.
- The alternative hypothesis represents the claim being investigated.
- Evidence is collected to determine whether there is convincing evidence against the null hypothesis.
- Hypothesis tests always compare the sample data with what would be expected if the null hypothesis were true.
- Decisions are made about the null hypothesis, not about proving the alternative hypothesis.
Common AP Exam Mistakes
| Incorrect | Correct |
|---|---|
| The null hypothesis is what the researcher hopes to prove. | The researcher’s claim is represented by the alternative hypothesis. |
| The alternative hypothesis is assumed to be true. | Only the null hypothesis is assumed true until sufficient evidence suggests otherwise. |
| A hypothesis test proves the alternative hypothesis. | A hypothesis test only determines whether there is convincing evidence against the null hypothesis. |
Example
A manufacturer claims that 90% of its products pass inspection on the first attempt.
An engineer believes the true proportion is lower.
Identify which statement represents the null hypothesis and which represents the alternative hypothesis.
▶️ Answer / Explanation
Null Hypothesis:
The manufacturer’s claim that 90% of products pass inspection represents the null hypothesis because it is the current claim being tested.
Alternative Hypothesis:
The engineer’s belief that the true proportion is lower represents the alternative hypothesis because it is the claim for which evidence is being collected.
3.5.B.2 Writing Null and Alternative Hypotheses
When writing hypotheses for a one-sample z-test for a population proportion, the null hypothesis always contains an equality.
The equality may be written as \(=\), \(\le\), or \(\ge\). However, in AP Statistics, the null hypothesis is always tested at the boundary of equality.
The alternative hypothesis expresses the researcher’s claim and determines whether the test is one-sided or two-sided.
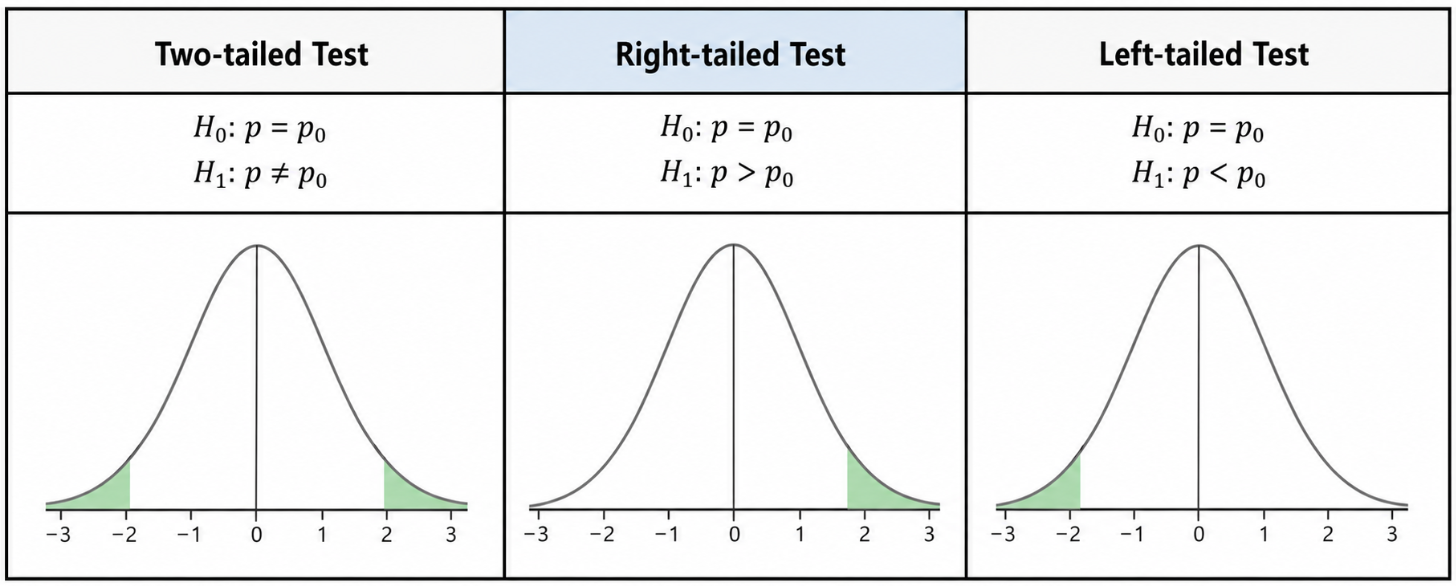
- If the alternative hypothesis uses \(<\) or \(>\), the test is one-sided.
- If the alternative hypothesis uses \(\neq\), the test is two-sided.
Forms of Hypotheses
| Research Question | Alternative Hypothesis | Type of Test |
|---|---|---|
| Is the population proportion greater than the claimed value? | \(H_a:p>p_0\) | Right-tailed (one-sided) |
| Is the population proportion less than the claimed value? | \(H_a:p<p_0\) | Left-tailed (one-sided) |
| Is the population proportion different from the claimed value? | \(H_a:p\neq p_0\) | Two-sided |
Writing the Null Hypothesis
Although the original claim may use \(\ge\) or \(\le\), the null hypothesis is always written using the equality value.
For example:
- “At least 70%” → \(H_0:p=0.70\)
- “No more than 45%” → \(H_0:p=0.45\)
- “Exactly 60%” → \(H_0:p=0.60\)
Example 1
A restaurant claims that 80% of customers are satisfied with their service.
A customer believes that the true satisfaction rate is less than 80%.
Hypotheses:
\(H_0:p=0.80\)
\(H_a:p<0.80\)
Type of Test: Left-tailed (one-sided)
Example 2
A school reports that 65% of students participate in extracurricular activities.
A researcher wants to determine whether the true proportion is different from 65%.
Hypotheses:
\(H_0:p=0.65\)
\(H_a:p\neq0.65\)
Type of Test: Two-sided
Important AP Exam Notes
- The null hypothesis always contains the equality.
- The alternative hypothesis never contains an equality symbol.
- The wording of the research question determines the alternative hypothesis.
- \(<\) or \(>\) in the alternative hypothesis indicates a one-sided test.
- \(\neq\) in the alternative hypothesis indicates a two-sided test.
- Always write hypotheses using the population proportion \(p\), never the sample proportion \(\hat{p}\).
Common AP Exam Mistakes
| Incorrect | Correct |
|---|---|
| Writing \(H_0:p>0.60\). | The null hypothesis must use equality: \(H_0:p=0.60\). |
| Using \(\hat{p}\) in the hypotheses. | Always write hypotheses using the population proportion \(p\). |
| Using an equality sign in the alternative hypothesis. | The alternative hypothesis uses only \(<\), \(>\), or \(\neq\). |
Example
A phone manufacturer claims that 92% of its smartphones pass a quality inspection.
An engineer believes that the true proportion is lower than 92%.
State the null hypothesis, the alternative hypothesis, and identify the type of hypothesis test.
▶️ Answer / Explanation
Null Hypothesis:
\(H_0:p=0.92\)
Alternative Hypothesis:
\(H_a:p<0.92\)
Type of Test:
This is a left-tailed (one-sided) hypothesis test because the alternative hypothesis uses the “<” symbol.
3.5.B.3 Writing Hypotheses for a One-Sample z-Test for a Population Proportion
For a one-sample z-test for a population proportion, the hypotheses are written using the population proportion \(p\) and the hypothesized value \(p_0\).
The value \(p_0\) is the claimed or hypothesized population proportion that is assumed to be true under the null hypothesis.
- The null hypothesis always states that the population proportion is equal to the hypothesized value.
- The alternative hypothesis depends on the research question and determines whether the test is left-tailed, right-tailed, or two-tailed.
General Forms of the Hypotheses
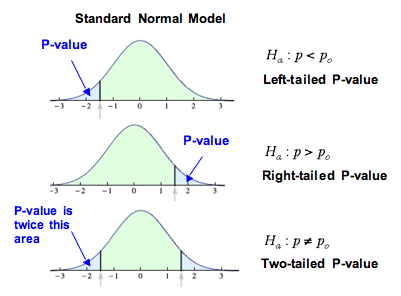
| Type of Test | Null Hypothesis | Alternative Hypothesis |
|---|---|---|
| Left-tailed | \(H_0:p=p_0\) | \(H_a:p<p_0\) |
| Right-tailed | \(H_0:p=p_0\) | \(H_a:p>p_0\) |
| Two-tailed | \(H_0:p=p_0\) | \(H_a:p\neq p_0\) |
Choosing the Correct Alternative Hypothesis
| Research Claim | Alternative Hypothesis |
|---|---|
| Less than the claimed value | \(H_a:p<p_0\) |
| Greater than the claimed value | \(H_a:p>p_0\) |
| Different from the claimed value | \(H_a:p\neq p_0\) |
Example 1: Left-Tailed Test
A manufacturer claims that 90% of its products pass inspection.
An inspector believes the true passing rate is less than 90%.
Hypotheses:
\(H_0:p=0.90\)
\(H_a:p<0.90\)
Example 2: Right-Tailed Test
A fitness program claims that 40% of members exercise at least five days per week.
A researcher believes the true proportion is greater than 40%.
Hypotheses:
\(H_0:p=0.40\)
\(H_a:p>0.40\)
Example 3: Two-Tailed Test
A university reports that 55% of students live on campus.
A researcher wants to determine whether the true proportion is different from 55%.
Hypotheses:
\(H_0:p=0.55\)
\(H_a:p\neq0.55\)
Important AP Exam Notes
- The null hypothesis is always written as \(H_0:p=p_0\).
- \(p_0\) is the hypothesized population proportion.
- The alternative hypothesis determines whether the test is left-tailed, right-tailed, or two-tailed.
- Write hypotheses using the population proportion \(p\), not the sample proportion \(\hat{p}\).
- Choose the alternative hypothesis based on the wording of the research question or claim.
Common AP Exam Mistakes
| Incorrect | Correct |
|---|---|
| Writing \(H_0:p\ge0.70\). | Write the null hypothesis as \(H_0:p=0.70\). |
| Using \(\hat{p}\) in the hypotheses. | Use the population proportion \(p\). |
| Choosing the wrong alternative hypothesis. | Match the alternative hypothesis to the wording of the research claim (less than, greater than, or different from). |
Example
A health agency claims that 30% of adults receive an annual flu vaccine.
A researcher believes the true proportion is greater than 30%.
Write the null hypothesis and the alternative hypothesis for this one-sample z-test.
▶️ Answer / Explanation
Null Hypothesis:
\(H_0:p=0.30\)
Alternative Hypothesis:
\(H_a:p>0.30\)
Explanation:
The claim being investigated is that the population proportion is greater than the hypothesized value of 0.30, so a right-tailed one-sample z-test is appropriate.
3.5.C.1 Conditions for a One-Sample z-Test for a Population Proportion
Before performing a one-sample z-test for a population proportion, you must verify that the required conditions are satisfied.
These conditions ensure that the sample is appropriate and that the Normal model can be used to calculate the test statistic and p-value.
There are three required conditions:
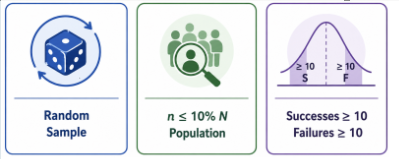
- Randomization Condition — The data must come from a random sample or a properly randomized experiment.
- 10% Condition — If sampling is done without replacement, the sample size must be no more than 10% of the population.
- Normality (Large Counts) Condition — The expected numbers of successes and failures, calculated using the hypothesized population proportion \(p_0\), must each be at least 10.
Conditions to Verify
| Condition | Requirement |
|---|---|
| Randomization | Data are collected using a random sample or randomized experiment. |
| 10% Condition | \(n\le0.10N\) when sampling without replacement. |
| Normality (Large Counts) | Expected successes \(np_0\ge10\) and expected failures \(n(1-p_0)\ge10\). |
Normality (Large Counts) Condition
For a hypothesis test, the expected numbers of successes and failures are calculated using the hypothesized population proportion \(p_0\) from the null hypothesis.
The following two conditions must both be satisfied:
\(np_0\ge10\) and \(n(1-p_0)\ge10\)
Where:
- \(n\) = Sample size
- \(p_0\) = Hypothesized population proportion from the null hypothesis
- \(np_0\) = Expected number of successes
- \(n(1-p_0)\) = Expected number of failures
Example 1: All Conditions Are Satisfied
A company claims that 70% of its customers are satisfied with its service.
A random sample of 250 customers is selected from a population of 8,000 customers.
Step 1: Check the Randomization Condition.
The customers were selected using a simple random sample, so this condition is satisfied.
Step 2: Check the 10% Condition.
\(0.10(8000)=800\)
Since
\(250\le800\)
the 10% Condition is satisfied.
Step 3: Check the Normality Condition.
\(np_0=250(0.70)=175\)
\(n(1-p_0)=250(0.30)=75\)
Both values are at least 10.
Conclusion:
All three conditions are satisfied, so a one-sample z-test for a population proportion is appropriate.
Example 2: Normality Condition Is Not Satisfied
A manufacturer claims that only 5% of its products are defective.
A random sample of 100 products is selected.
Step 1: Calculate the expected number of successes.
\(np_0=100(0.05)=5\)
Step 2: Calculate the expected number of failures.
\(n(1-p_0)=100(0.95)=95\)
Since
\(5<10\)
the Normality Condition is not satisfied.
Conclusion:
A one-sample z-test for a population proportion should not be used.
Important AP Exam Notes
- Always verify the Randomization Condition, 10% Condition, and Normality Condition before conducting a hypothesis test.
- For a hypothesis test, use the hypothesized proportion \(p_0\) when checking the Normality Condition.
- Do not use the sample proportion \(\hat{p}\) when verifying the Large Counts Condition for a hypothesis test.
- The 10% Condition is only required when sampling without replacement.
- If any condition is not satisfied, the one-sample z-test is not appropriate.
Common AP Exam Mistakes
| Incorrect | Correct |
|---|---|
| Using \(n\hat{p}\) and \(n(1-\hat{p})\) to check the Normality Condition. | Use \(np_0\) and \(n(1-p_0)\), where \(p_0\) comes from the null hypothesis. |
| Checking only the Normality Condition. | Verify all three required conditions. |
| Applying the 10% Condition when sampling with replacement. | The 10% Condition applies only when sampling without replacement. |
Example
A company claims that 60% of its customers renew their memberships.
A simple random sample of 200 customers is selected from a population of 5,000 customers.
Determine whether it is appropriate to perform a one-sample z-test for a population proportion.
▶️ Answer / Explanation
Randomization Condition:
The sample is a simple random sample, so this condition is satisfied.
10% Condition:
\(0.10(5000)=500\)
Since
\(200\le500\)
the 10% Condition is satisfied.
Normality Condition:
\(np_0=200(0.60)=120\ge10\)
\(n(1-p_0)=200(0.40)=80\ge10\)
Answer:
All three conditions are satisfied, so it is appropriate to perform a one-sample z-test for a population proportion.