
3.6.A.1 Interpreting the p-value for a One-Sample z-Test for a Population Proportion
After calculating the test statistic, the next step in a hypothesis test is to determine the p-value.
The p-value is calculated under the assumption that the null hypothesis (\(H_0\)) is true.
It represents the probability of obtaining a test statistic that is as extreme as or more extreme than the one observed, in the direction specified by the alternative hypothesis.
- A small p-value indicates that the observed sample result would be unlikely if the null hypothesis were true, providing stronger evidence against \(H_0\).
- A large p-value indicates that the observed result is reasonably likely if the null hypothesis is true, providing little evidence against \(H_0\).
Definition of the p-value
| Term | Meaning |
|---|---|
| Null Distribution | The probability distribution of the test statistic assuming the null hypothesis is true. |
| p-value | The probability of obtaining a test statistic as extreme as or more extreme than the observed value, assuming \(H_0\) is true. |
Finding the p-value
The method used to calculate the p-value depends on the alternative hypothesis.
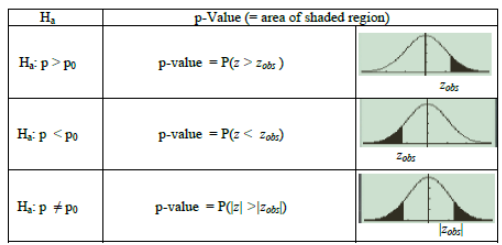
| Alternative Hypothesis | p-value Calculation |
|---|---|
| \(H_a:p>p_0\) | \(P(z\ge z_{\text{obs}})\) |
| \(H_a:p<p_0\) | \(P(z\le z_{\text{obs}})\) |
| \(H_a:p\neq p_0\) | \(P(z\le-|z_{\text{obs}}|)+P(z\ge|z_{\text{obs}}|)\) |
Example 1: Right-Tailed Test
A hypothesis test produces a test statistic of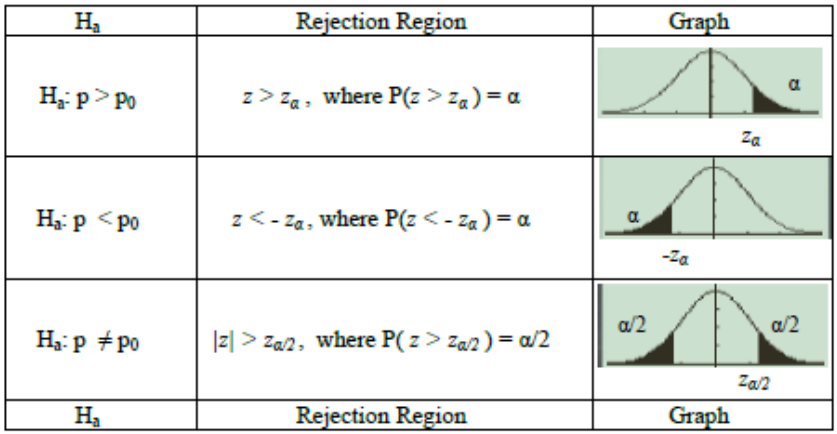
\(z=2.10\)
with the alternative hypothesis
\(H_a:p>p_0\)
The p-value is the probability of obtaining a z-score of 2.10 or greater.
\(P(z\ge2.10)\)
Example 2: Left-Tailed Test
A hypothesis test produces
\(z=-1.85\)
with the alternative hypothesis
\(H_a:p<p_0\)
The p-value is
\(P(z\le-1.85)\)
Example 3: Two-Tailed Test
A hypothesis test produces
\(z=2.25\)
with the alternative hypothesis
\(H_a:p\neq p_0\)
The p-value is the combined probability in both tails.
\(P(z\le-2.25)+P(z\ge2.25)\)
Interpreting the Size of the p-value
| Size of p-value | Interpretation |
|---|---|
| Small (close to 0) | Strong evidence against the null hypothesis. |
| Large (close to 1) | Little evidence against the null hypothesis. |
Important AP Exam Notes
- The p-value is always calculated assuming the null hypothesis is true.
- The p-value measures the probability of obtaining results as extreme as or more extreme than the observed result.
- The direction of the alternative hypothesis determines whether the p-value comes from the left tail, right tail, or both tails.
- A small p-value provides stronger evidence against the null hypothesis.
- The p-value is not the probability that the null hypothesis is true.
Common AP Exam Mistakes
| Incorrect | Correct |
|---|---|
| The p-value is the probability that the null hypothesis is true. | The p-value is calculated assuming the null hypothesis is true. |
| Always using one tail to calculate the p-value. | Use the tail(s) determined by the alternative hypothesis. |
| Ignoring the phrase “or more extreme.” | Include all values at least as extreme as the observed test statistic. |
Example
A one-sample z-test for a population proportion produces a test statistic of \(z=-2.15\) for the hypotheses
\(H_0:p=0.40\)
\(H_a:p<0.40\)
Describe how the p-value is determined and explain what it represents.
▶️ Answer / Explanation
Because the alternative hypothesis is left-tailed, the p-value is
\(P(z\le-2.15)\)
This is the probability, assuming the null hypothesis is true, of obtaining a test statistic of -2.15 or smaller.
It represents the probability of observing a result at least as extreme as the sample result in the direction of the alternative hypothesis if the true population proportion is actually 0.40.
3.6.A.2 Interpreting the p-value from a Simulated Null Distribution
Sometimes, instead of using the standard Normal distribution, the null distribution of the test statistic is generated through simulation.
In this case, the p-value is calculated as the proportion of simulated test statistics that are as extreme as or more extreme than the observed test statistic, in the direction specified by the alternative hypothesis.
Rather than calculating probabilities from the Normal distribution, you count the simulated results that are at least as extreme as the observed statistic and divide by the total number of simulations.
Formula for a Simulated p-value
\(\text{p-value}=\dfrac{\text{Number of simulated statistics at least as extreme as the observed statistic}}{\text{Total number of simulated statistics}}\)
Determining the p-value from a Simulation
| Alternative Hypothesis | Simulated p-value |
|---|---|
| \(H_a:p>p_0\) | Proportion of simulated statistics at or above the observed test statistic. |
| \(H_a:p<p_0\) | Proportion of simulated statistics at or below the observed test statistic. |
| \(H_a:p\neq p_0\) | Proportion of simulated statistics less than or equal to \(-|z_{\text{obs}}|\) plus the proportion greater than or equal to \(|z_{\text{obs}}|\). |
Example 1: Right-Tailed Test
A simulation generates 5,000 test statistics.
The observed test statistic is
\(z=2.10\)
Among the simulated statistics, 95 are at least 2.10.
Calculate the p-value.
\(\text{p-value}=\dfrac{95}{5000}=0.019\)
Interpretation:
Assuming the null hypothesis is true, about 1.9% of simulated samples produced a test statistic at least as large as the observed value.
Example 2: Left-Tailed Test
A simulation generates 10,000 test statistics.
The observed test statistic is
\(z=-1.85\)
Among the simulated values, 412 are at or below -1.85.
Calculate the p-value.
\(\text{p-value}=\dfrac{412}{10000}=0.0412\)
Example 3: Two-Tailed Test
A simulation produces 8,000 test statistics.
The observed statistic is
\(z=2.30\)
There are
- 74 simulated statistics less than or equal to -2.30.
- 78 simulated statistics greater than or equal to 2.30.
Calculate the p-value.
\(\text{p-value}=\dfrac{74+78}{8000}=\dfrac{152}{8000}=0.019\)
Important AP Exam Notes
- When using simulations, the p-value is a proportion, not a Normal probability.
- The p-value includes simulated statistics that are as extreme as or more extreme than the observed statistic.
- The direction of the alternative hypothesis determines which simulated values are counted.
- For a two-sided test, include both tails of the simulated null distribution.
- A smaller simulated p-value provides stronger evidence against the null hypothesis.
Common AP Exam Mistakes
| Incorrect | Correct |
|---|---|
| Counting only statistics more extreme on one side for a two-tailed test. | Include both tails for a two-sided alternative hypothesis. |
| Ignoring values equal to the observed statistic. | Count values that are as extreme as or more extreme than the observed statistic. |
| Using the Normal distribution formula when a simulation is provided. | Use the proportion of simulated statistics from the null distribution. |
Example
A simulation under the null hypothesis generates 4,000 test statistics.
The observed test statistic is 2.45, and 52 simulated statistics are greater than or equal to 2.45.
The alternative hypothesis is
\(H_a:p>p_0\)
Calculate and interpret the p-value.
▶️ Answer / Explanation
Step 1: Calculate the p-value.
\(\text{p-value}=\dfrac{52}{4000}=0.013\)
Interpretation:
Assuming the null hypothesis is true, about 1.3% of simulated samples produced a test statistic that was at least as large as the observed value. This small p-value provides evidence against the null hypothesis.
3.6.A.3 Interpreting the p-value in Context
When interpreting a p-value, always begin by stating that it is calculated assuming the null hypothesis is true.
- This means we assume that the true population proportion is equal to the value stated in the null hypothesis.
- The p-value represents the probability of obtaining a test statistic that is as extreme as or more extreme than the observed test statistic, in the direction of the alternative hypothesis, if the null hypothesis is true.
A complete AP Statistics interpretation should include:
- That the null hypothesis is assumed to be true.
- The population proportion stated in the null hypothesis.
- The probability of obtaining the observed result (or one more extreme).
- The context of the study.
General Interpretation Template
Assuming that the true population proportion is \(p_0\), the p-value is the probability of obtaining a sample result (or test statistic) as extreme as or more extreme than the one observed simply due to random sampling.
Example
A company claims that 70% of its customers are satisfied with its service.
A hypothesis test produces a p-value of
\(0.018\)
Interpretation:
Assuming that the true proportion of all customers who are satisfied is 0.70, there is a 1.8% chance of obtaining a sample result at least as extreme as the one observed due to random sampling alone.
3.6.A.4 Interpreting a Small p-value
A small p-value indicates that the observed sample result would be unusual if the null hypothesis were true.
- Therefore, a small p-value provides convincing statistical evidence in favor of the alternative hypothesis.
- The smaller the p-value, the stronger the statistical evidence against the null hypothesis.
Relationship Between the p-value and Evidence
| p-value | Evidence Against \(H_0\) |
|---|---|
| Very small | Very strong evidence for the alternative hypothesis. |
| Moderately small | Moderate evidence for the alternative hypothesis. |
| Large | Little or no evidence for the alternative hypothesis. |
Example
A hypothesis test produces
\(p\text{-value}=0.003\)
Since the p-value is very small, the observed sample result would be highly unusual if the null hypothesis were true.
Therefore, there is very convincing statistical evidence supporting the alternative hypothesis.
3.6.A.5 Interpreting a Large p-value
A large p-value indicates that the observed sample result would not be unusual if the null hypothesis were true.
- Therefore, the sample data do not provide convincing statistical evidence for the alternative hypothesis.
- However, a large p-value does not prove that the null hypothesis is true.
Instead, it means that the sample data are consistent with the null hypothesis, and there is insufficient evidence to conclude otherwise.
Example
A hypothesis test produces
\(p\text{-value}=0.41\)
Since the p-value is large, the observed sample result is not unusual if the null hypothesis is true.
Therefore, there is not convincing statistical evidence supporting the alternative hypothesis.
This does not mean that the null hypothesis has been proven true.
Important AP Exam Notes
- Always interpret the p-value by stating that the null hypothesis is assumed to be true.
- A small p-value provides stronger evidence against the null hypothesis.
- The smaller the p-value, the more convincing the evidence for the alternative hypothesis.
- A large p-value means the data are consistent with the null hypothesis.
- A large p-value does not prove that the null hypothesis is true.
- The p-value measures the strength of the evidence in the sample data, not the probability that a hypothesis is true.
Common AP Exam Mistakes
| Incorrect | Correct |
|---|---|
| The p-value is the probability that the null hypothesis is true. | The p-value is calculated assuming the null hypothesis is true. |
| A large p-value proves the null hypothesis. | A large p-value only indicates insufficient evidence against the null hypothesis. |
| A small p-value guarantees the alternative hypothesis is true. | A small p-value provides convincing statistical evidence for the alternative hypothesis. |
Example
A company claims that 80% of its customers are satisfied with its products.
A one-sample z-test produces a p-value of 0.012.
Interpret the p-value and explain what it indicates about the hypotheses.
▶️ Answer / Explanation
Interpretation of the p-value:
Assuming that the true proportion of all customers who are satisfied is 0.80, there is a 1.2% chance of obtaining a sample result at least as extreme as the one observed due to random sampling alone.
Conclusion:
Because the p-value is small, the observed result would be unusual if the null hypothesis were true. Therefore, there is convincing statistical evidence supporting the alternative hypothesis.