
3.7.A.1 Calculating the Test Statistic for a One-Sample z-Test for a Population Proportion
After verifying that all conditions for a hypothesis test are satisfied, the next step is to calculate the test statistic.
- The test statistic measures how many standard errors the observed sample proportion is from the hypothesized population proportion stated in the null hypothesis.
- If the null hypothesis is true, the test statistic follows an approximately standard Normal distribution.
A test statistic close to 0 indicates that the sample proportion is close to the hypothesized population proportion.
A test statistic with a large positive or negative value indicates that the sample result is farther from the hypothesized value and provides stronger evidence against the null hypothesis.
Formula for the Test Statistic
\(z=\dfrac{\hat{p}-p_0}{\sqrt{\dfrac{p_0(1-p_0)}{n}}}\)
Where:
- \(\hat{p}\) = Sample proportion
- \(p_0\) = Hypothesized population proportion from the null hypothesis
- \(n\) = Sample size
- \(z\) = Test statistic
Understanding the Formula
- The numerator, \(\hat{p}-p_0\), measures how far the sample proportion is from the hypothesized population proportion.
- The denominator, \(\sqrt{\dfrac{p_0(1-p_0)}{n}}\), is the standard error calculated under the assumption that the null hypothesis is true.
- The test statistic tells us how many standard errors the observed sample proportion is above or below the hypothesized proportion.
Interpreting the Test Statistic
| Value of \(z\) | Interpretation |
|---|---|
| Approximately 0 | The sample proportion is close to the hypothesized proportion. |
| Large positive value | The sample proportion is much greater than the hypothesized proportion. |
| Large negative value | The sample proportion is much less than the hypothesized proportion. |
Example 1
A company claims that 60% of its customers renew their memberships.
A random sample of 200 customers is selected, and 140 renew their memberships.
Step 1: Calculate the sample proportion.
\(\hat{p}=\dfrac{140}{200}=0.70\)
Step 2: Identify the hypothesized proportion.
\(p_0=0.60\)
Step 3: Calculate the standard error.
\(\sqrt{\dfrac{0.60(0.40)}{200}}=\sqrt{0.0012}\approx0.0346\)
Step 4: Calculate the test statistic.
\(z=\dfrac{0.70-0.60}{0.0346}\approx2.89\)
Interpretation:
The sample proportion is approximately 2.89 standard errors above the hypothesized population proportion.
Example 2
A school claims that 75% of students participate in extracurricular activities.
A random sample of 160 students is selected, and 108 participate.
Step 1:
\(\hat{p}=\dfrac{108}{160}=0.675\)
Step 2:
\(p_0=0.75\)
Step 3:
\(SE=\sqrt{\dfrac{0.75(0.25)}{160}}\approx0.0342\)
Step 4:
\(z=\dfrac{0.675-0.75}{0.0342}\approx-2.19\)
Interpretation:
The sample proportion is approximately 2.19 standard errors below the hypothesized population proportion.
Important AP Exam Notes
- Use the hypothesized population proportion \(p_0\) when calculating the standard error for a hypothesis test.
- The test statistic measures the number of standard errors between \(\hat{p}\) and \(p_0\).
- A positive test statistic means \(\hat{p}>p_0\).
- A negative test statistic means \(\hat{p}<p_0\).
- If the null hypothesis is true, the test statistic follows an approximately standard Normal distribution.
Common AP Exam Mistakes
| Incorrect | Correct |
|---|---|
| Using \(\hat{p}\) in the standard error. | Use the hypothesized proportion \(p_0\) when calculating the standard error for a hypothesis test. |
| Interpreting the test statistic as a probability. | The test statistic measures the number of standard errors from the hypothesized value. |
| Ignoring the sign of the test statistic. | A positive or negative sign indicates whether the sample proportion is above or below the hypothesized proportion. |
Example
A manufacturer claims that 85% of its products pass inspection.
A random sample of 300 products is selected, and 240 pass inspection.
Calculate the test statistic for testing the manufacturer’s claim.
▶️ Answer / Explanation
Step 1:
\(\hat{p}=\dfrac{240}{300}=0.80\)
Step 2:
\(p_0=0.85\)
Step 3:
\(SE=\sqrt{\dfrac{0.85(0.15)}{300}}\approx0.0206\)
Step 4:
\(z=\dfrac{0.80-0.85}{0.0206}\approx-2.43\)
Answer:
The test statistic is approximately \(-2.43\), meaning the sample proportion is about 2.43 standard errors below the hypothesized population proportion.
3.7.A.2 Distribution of the Test Statistic Under the Null Hypothesis
When performing a one-sample z-test for a population proportion, the test statistic is calculated under the assumption that the null hypothesis (\(H_0\)) is true.
If all required conditions are satisfied, the distribution of the test statistic under the null hypothesis, called the null distribution, can be approximated by a probability model, such as the standard Normal distribution.
This allows statisticians to calculate probabilities (p-values) and determine whether the observed sample result is unusual under the null hypothesis.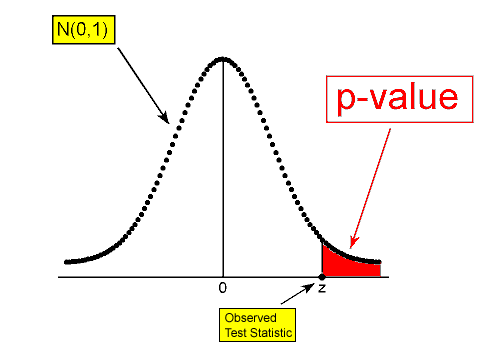
Null Distribution
The null distribution is the probability distribution of the test statistic that would occur if the null hypothesis were true.
For a one-sample z-test for a population proportion, the null distribution is approximately a
Standard Normal Distribution
provided that the Randomization, 10% (if needed), and Normality (Large Counts) Conditions are satisfied.
Characteristics of the Null Distribution
| Characteristic | Description |
|---|---|
| Center | Mean = 0 |
| Standard Deviation | 1 |
| Shape | Approximately Normal |
| Used For | Finding p-values and making decisions about the hypotheses. |
Example 1
A manufacturer claims that 80% of its products meet quality standards.
A hypothesis test is performed, and the calculated test statistic is
\(z=1.82\)
Since all conditions are satisfied, the null distribution of the test statistic is approximately a standard Normal distribution.
The p-value is found by locating 1.82 on the standard Normal distribution.
Example 2
A school claims that 65% of students participate in extracurricular activities.
A hypothesis test produces
\(z=-2.10\)
Because the conditions for a one-sample z-test are satisfied, the sampling distribution of the test statistic under the null hypothesis is approximately standard Normal.
The probability of observing a test statistic of -2.10 or more extreme is determined from the standard Normal distribution.
Why Use the Standard Normal Distribution?
- It provides a probability model for the test statistic when the null hypothesis is true.
- It allows us to calculate the p-value.
- It helps determine whether the observed sample result is unusual.
- It provides the basis for deciding whether to reject or fail to reject the null hypothesis.
Important AP Exam Notes
- The null distribution assumes that the null hypothesis is true.
- For a one-sample z-test for a population proportion, the null distribution is approximately standard Normal when the required conditions are met.
- The standard Normal distribution has a mean of 0 and a standard deviation of 1.
- The p-value is calculated from this null distribution.
- If the required conditions are not satisfied, the standard Normal model should not be used.
Common AP Exam Mistakes
| Incorrect | Correct |
|---|---|
| Using the standard Normal distribution without checking conditions. | Verify all required conditions before using the standard Normal model. |
| Thinking the null distribution is based on the sample proportion. | The null distribution assumes the null hypothesis is true and is based on the hypothesized proportion \(p_0\). |
| Believing the test statistic can follow any distribution. | For a one-sample z-test, the test statistic is approximately standard Normal when conditions are met. |
Example
A hypothesis test for a population proportion produces a test statistic of
\(z=2.35\)
All required conditions for a one-sample z-test are satisfied.
Explain why the standard Normal distribution can be used to determine the p-value.
▶️ Answer / Explanation
Because the Randomization, 10% (if required), and Normality Conditions are satisfied, the distribution of the test statistic under the null hypothesis can be approximated by a standard Normal distribution.
Therefore, the probability of obtaining a test statistic as extreme as or more extreme than \(z=2.35\) can be calculated using the standard Normal distribution to obtain the p-value.
3.7.A.3 Calculating the p-value Using the Standard Normal Distribution
Once the test statistic has been calculated, the next step in a hypothesis test is to determine the p-value.
For a one-sample z-test for a population proportion, the p-value is found using the standard Normal distribution.
The p-value is the probability of obtaining a test statistic that is as extreme as or more extreme than the observed test statistic, assuming the null hypothesis is true.
On the AP Statistics Exam, the p-value may be found using:
- A standard Normal (z) table.
- A graphing calculator.
- Statistical software or other approved technology.
Finding the p-value
| Alternative Hypothesis | Calculator / Table Probability |
|---|---|
| \(H_a:p>p_0\) | Right-tail probability: \(P(Z\ge z)\) |
| \(H_a:p<p_0\) | Left-tail probability: \(P(Z\le z)\) |
| \(H_a:p\neq p_0\) | Both-tail probability: \(P(Z\le-|z|)+P(Z\ge|z|)\) |
Example 1: Right-Tailed Test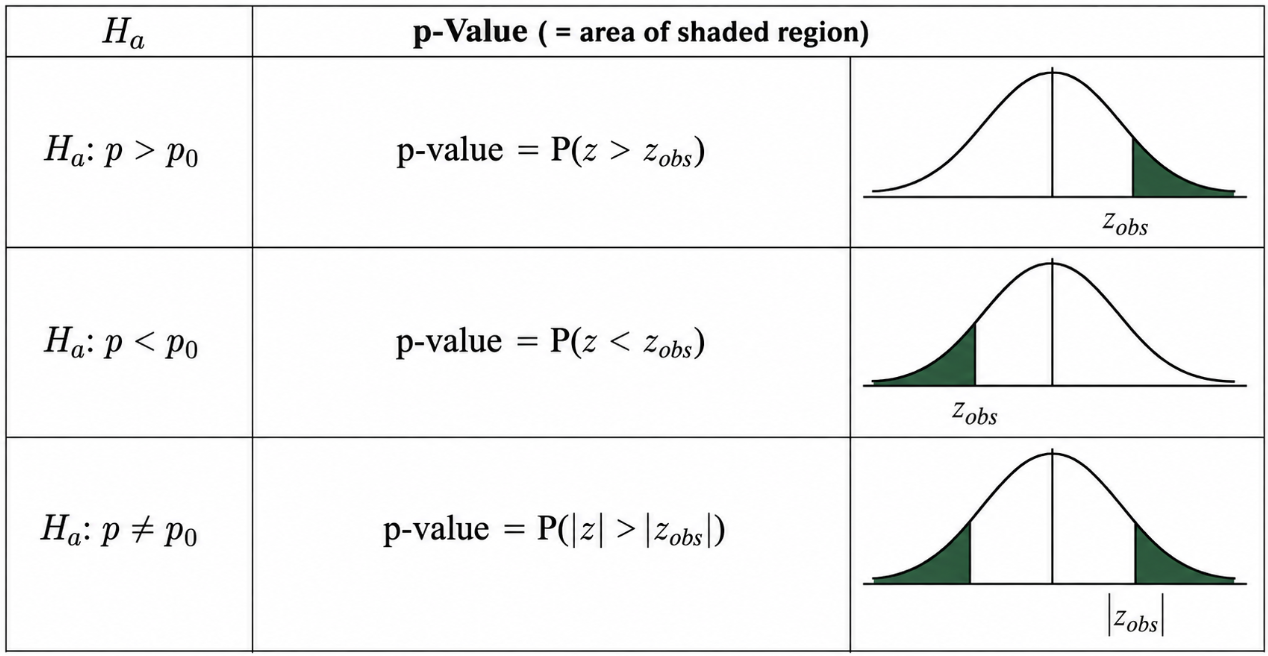
A one-sample z-test produces
\(z=2.15\)
with the alternative hypothesis
\(H_a:p>p_0\)
Using the standard Normal distribution:
\(P(Z\ge2.15)\approx0.0158\)
Therefore,
p-value \(=0.0158\)
Example 2: Left-Tailed Test
A hypothesis test produces
\(z=-1.73\)
with
\(H_a:p<p_0\)
Using the standard Normal distribution:
\(P(Z\le-1.73)\approx0.0418\)
Therefore,
p-value \(=0.0418\)
Example 3: Two-Tailed Test
A hypothesis test produces
\(z=2.05\)
with
\(H_a:p\neq p_0\)
Step 1: Find one tail.
\(P(Z\ge2.05)\approx0.0202\)
Step 2: Double the probability.
p-value \(=2(0.0202)=0.0404\)
Using Technology
Graphing calculators and statistical software can calculate p-values directly from the test statistic.
Using technology reduces rounding error and is the preferred method on the AP Statistics Exam.
Important AP Exam Notes
- The p-value is found using the standard Normal distribution after calculating the test statistic.
- The direction of the alternative hypothesis determines whether to use the left tail, right tail, or both tails.
- For a two-sided test, remember to include both tails of the distribution.
- The p-value may be calculated using a z-table or technology.
- Always report the p-value in the context of the hypothesis test.
Common AP Exam Mistakes
| Incorrect | Correct |
|---|---|
| Using only one tail for a two-sided test. | Include both tails when \(H_a:p\neq p_0\). |
| Using the wrong tail of the Normal distribution. | Choose the tail based on the alternative hypothesis. |
| Using the sample proportion instead of the test statistic to find the p-value. | The p-value is calculated from the z-test statistic. |
AP Exam Example
A one-sample z-test for a population proportion produces a test statistic of
\(z=1.92\)
for the hypotheses
\(H_0:p=0.50\)
\(H_a:p>0.50\)
Calculate the p-value using the standard Normal distribution.
▶️ Answer / Explanation
Because the alternative hypothesis is right-tailed, calculate
\(P(Z\ge1.92)\)
Using a standard Normal table or technology,
\(P(Z\ge1.92)\approx0.0274\)
Answer:
The p-value is approximately 0.0274.
This means that, assuming the null hypothesis is true, there is about a 2.74% chance of obtaining a test statistic of 1.92 or greater.
3.7.B.1 Significance Level and Statistical Significance
Before conducting a hypothesis test, the researcher chooses a significance level, denoted by \(\alpha\).
- The significance level is the predetermined probability of rejecting the null hypothesis when the null hypothesis is actually true (a Type I error).
- The value of \(\alpha\) is selected before the data are analyzed and serves as the cutoff for deciding whether the sample provides convincing statistical evidence against the null hypothesis.
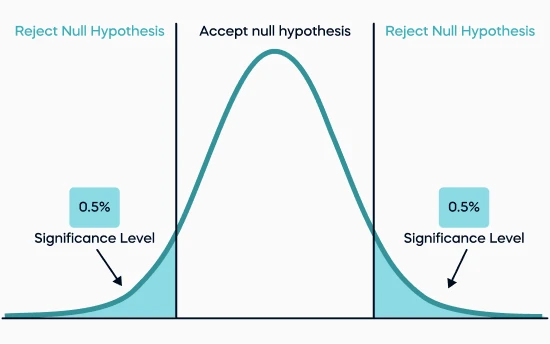
A hypothesis test is considered statistically significant if the p-value is less than or equal to the significance level.
Common Significance Levels
| Significance Level | Meaning |
|---|---|
| \(\alpha=0.10\) | 10% risk of rejecting a true null hypothesis. |
| \(\alpha=0.05\) | 5% risk of rejecting a true null hypothesis. |
| \(\alpha=0.01\) | 1% risk of rejecting a true null hypothesis. |
Example
A researcher performs a hypothesis test using
\(\alpha=0.05\)
This means the researcher is willing to accept a 5% chance of rejecting the null hypothesis when it is actually true.
3.7.B.2 Making a Formal Decision Using the p-value
After calculating the p-value, compare it to the chosen significance level (\(\alpha\)).
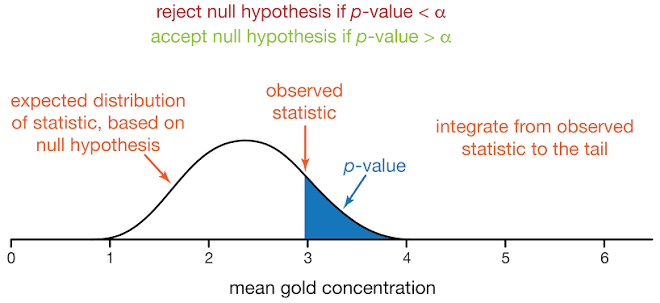
The decision rule is:
| Comparison | Decision |
|---|---|
| \(p\text{-value}\le\alpha\) | Reject \(H_0\) |
| \(p\text{-value}>\alpha\) | Fail to Reject \(H_0\) |
Example 1
A hypothesis test produces
\(p\text{-value}=0.021\)
with
\(\alpha=0.05\)
Since
\(0.021\le0.05\)
Decision: Reject the null hypothesis.
Example 2
A hypothesis test produces
\(p\text{-value}=0.18\)
with
\(\alpha=0.05\)
Since
\(0.18>0.05\)
Decision: Fail to reject the null hypothesis.
3.7.B.3 Interpreting the Decision
The formal decision from a hypothesis test determines whether there is convincing statistical evidence for the alternative hypothesis.
- Reject \(H_0\) means there is convincing statistical evidence supporting the alternative hypothesis.
- Fail to Reject \(H_0\) means there is not convincing statistical evidence supporting the alternative hypothesis.
Failing to reject the null hypothesis does not mean the null hypothesis is true. It only means that the sample did not provide enough evidence against it.
Decision and Interpretation Summary
| Decision | Interpretation |
|---|---|
| Reject \(H_0\) | There is convincing statistical evidence supporting the alternative hypothesis. |
| Fail to Reject \(H_0\) | There is not convincing statistical evidence supporting the alternative hypothesis. |
Important AP Exam Notes
- The significance level \(\alpha\) is chosen before collecting or analyzing the data.
- A result is statistically significant if \(p\text{-value}\le\alpha\).
- Always compare the p-value with the significance level before making a decision.
- Rejecting the null hypothesis supports the alternative hypothesis.
- Failing to reject the null hypothesis does not prove the null hypothesis is true.
Common AP Exam Mistakes
| Incorrect | Correct |
|---|---|
| Accept the null hypothesis. | Fail to reject the null hypothesis. |
| A large p-value proves the null hypothesis. | A large p-value only indicates insufficient evidence against the null hypothesis. |
| Reject the null hypothesis whenever the p-value is larger than \(\alpha\). | Reject only when \(p\text{-value}\le\alpha\). |
Example
A company claims that 75% of its customers renew their memberships.
A one-sample z-test produces a p-value of 0.032.
The significance level is
\(\alpha=0.05\)
Make a decision and interpret the result.
▶️ Answer / Explanation
Step 1: Compare the p-value with the significance level.
\(0.032\le0.05\)
Step 2: Make the decision.
Reject the null hypothesis.
Step 3: State the conclusion.
There is convincing statistical evidence supporting the alternative hypothesis about the true population proportion.
3.7.B.4 Understanding the Limitations of a Hypothesis Test
A hypothesis test can lead to only two possible decisions: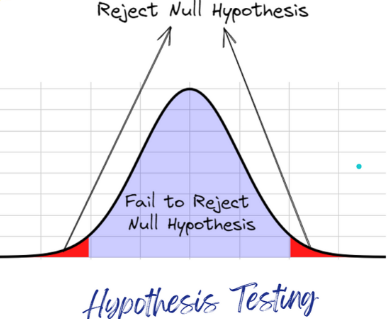
- Reject the null hypothesis (\(H_0\))
- Fail to reject the null hypothesis (\(H_0\))
A hypothesis test can never prove that the null hypothesis is true.
If the sample data do not provide convincing statistical evidence against the null hypothesis, the correct decision is to fail to reject the null hypothesis—not to accept or prove it.
Likewise, lack of evidence for the alternative hypothesis is not evidence that the null hypothesis is true.
Possible Decisions in a Hypothesis Test
| Decision | Correct Interpretation |
|---|---|
| Reject \(H_0\) | There is convincing statistical evidence supporting the alternative hypothesis. |
| Fail to Reject \(H_0\) | There is not convincing statistical evidence supporting the alternative hypothesis. |
Example
A hypothesis test produces a p-value of
\(0.38\)
Since the p-value is greater than the significance level, we fail to reject the null hypothesis.
Correct conclusion:
There is not convincing statistical evidence supporting the alternative hypothesis.
Incorrect conclusion:
“The null hypothesis is true.”
3.7.B.5 Using a Hypothesis Test to Answer an Investigative Question
The purpose of a hypothesis test is to answer an investigative question about a population using sample data.
- The results of the hypothesis test provide statistical reasoning that helps determine whether the sample provides convincing evidence for a claim about the population.
- The conclusion should always answer the original research question rather than simply stating the statistical decision.
Example
Investigative Question:
- “Has the proportion of students who participate in after-school clubs increased above 50%?”
- After performing the hypothesis test, the statistical conclusion should answer this question directly.
Example Conclusion:
“There is convincing statistical evidence that the proportion of students who participate in after-school clubs is greater than 50%.”
3.7.B.6 Writing a Conclusion in Context
The final conclusion of a hypothesis test should always be written in the context of the problem.
The conclusion should:
- Be consistent with the decision to reject or fail to reject the null hypothesis.
- Be written in terms of the alternative hypothesis.
- Use non-definitive language, such as “there is convincing statistical evidence” or “there is not convincing statistical evidence.”
- Refer to the population parameter and the population in context.
Recommended AP Exam Wording
| Decision | Recommended Conclusion |
|---|---|
| Reject \(H_0\) | There is convincing statistical evidence that the true population proportion… |
| Fail to Reject \(H_0\) | There is not convincing statistical evidence that the true population proportion… |
Example 1: Reject the Null Hypothesis
A hypothesis test investigates whether more than 65% of voters support a proposed law.
The test results in rejecting \(H_0\).
Appropriate Conclusion:
There is convincing statistical evidence that the true proportion of all voters who support the proposed law is greater than 65%.
Example 2: Fail to Reject the Null Hypothesis
A hypothesis test investigates whether fewer than 40% of customers are satisfied with a service.
The test results in failing to reject \(H_0\).
Appropriate Conclusion:
There is not convincing statistical evidence that the true proportion of all customers who are satisfied with the service is less than 40%.
Important AP Exam Notes
- A hypothesis test can only lead to rejecting or failing to reject the null hypothesis.
- Never state that the null hypothesis has been proven or accepted.
- Always answer the original investigative question using the results of the hypothesis test.
- Write conclusions in terms of the alternative hypothesis.
- Use phrases such as “there is convincing statistical evidence” or “there is not convincing statistical evidence”.
- Always reference the population proportion and the population in context.
Common AP Exam Mistakes
| Incorrect | Correct |
|---|---|
| Accept the null hypothesis. | Fail to reject the null hypothesis. |
| The null hypothesis is true. | There is not convincing statistical evidence against the null hypothesis. |
| There is proof that the alternative hypothesis is true. | There is convincing statistical evidence supporting the alternative hypothesis. |
| Writing the conclusion without mentioning the population. | State the conclusion in context and reference the population parameter. |
Example
A hypothesis test is conducted to determine whether the proportion of all high school students who get at least eight hours of sleep each night is greater than 35%.
The test produces a p-value of 0.083 with a significance level of
\(\alpha=0.05\)
Write an appropriate conclusion in context.
▶️ Answer / Explanation
Step 1: Compare the p-value and the significance level.
\(0.083>0.05\)
Fail to reject the null hypothesis.
Step 2: Write the conclusion in context.
There is not convincing statistical evidence that the true proportion of all high school students who get at least eight hours of sleep each night is greater than 35%.
Note: We do not conclude that the true proportion is exactly 35% or that the null hypothesis is true.