Statistical Inference and Scope of Conclusions
Statistical inference uses data from a sample or an experiment to make conclusions about a larger population or about cause-and-effect relationships. The type of conclusion depends on how the data were collected and whether randomization was used.
Random Assignment (Experiments) 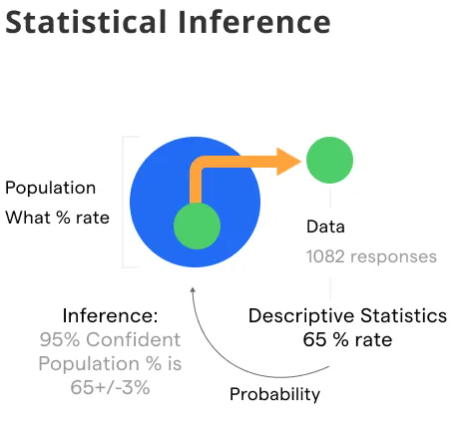
- Balances out lurking variables across treatment groups.
- Makes treatment groups comparable on average.
- Allows valid cause-and-effect conclusions if differences are significant.
Random Sampling (Surveys/Experiments)
- Ensures the sample represents the population.
- Reduces selection bias and increases generalizability.
- Allows conclusions from the sample to apply to the larger population.
Statistical Significance
- Indicates that observed results are unlikely due to chance alone.
- Commonly assessed using a 5% threshold or p-value.
- Helps determine whether an effect is real or random variation.
P-value
- Probability of observing results as extreme as those obtained, assuming the null hypothesis is true.

- Small p-value (e.g., < 0.05) provides strong evidence against the null.
- Used to decide whether to reject the null hypothesis.
Type I Error
- Rejecting the null hypothesis when it is actually true.
- Also called a “false positive.”
- Probability of Type I error is denoted by α (significance level).
Type II Error
- Failing to reject the null hypothesis when it is false.
- Also called a “false negative.”
- Probability of Type II error is denoted by β.
Power
- Probability of correctly rejecting a false null hypothesis (1 − β).
- Larger sample sizes increase power.
- High power reduces the risk of Type II errors.
Replication
- Repeating experiments or using larger sample sizes improves reliability.
- Ensures results are consistent across studies.
- Reduces the chance that observed effects are due to random variation.
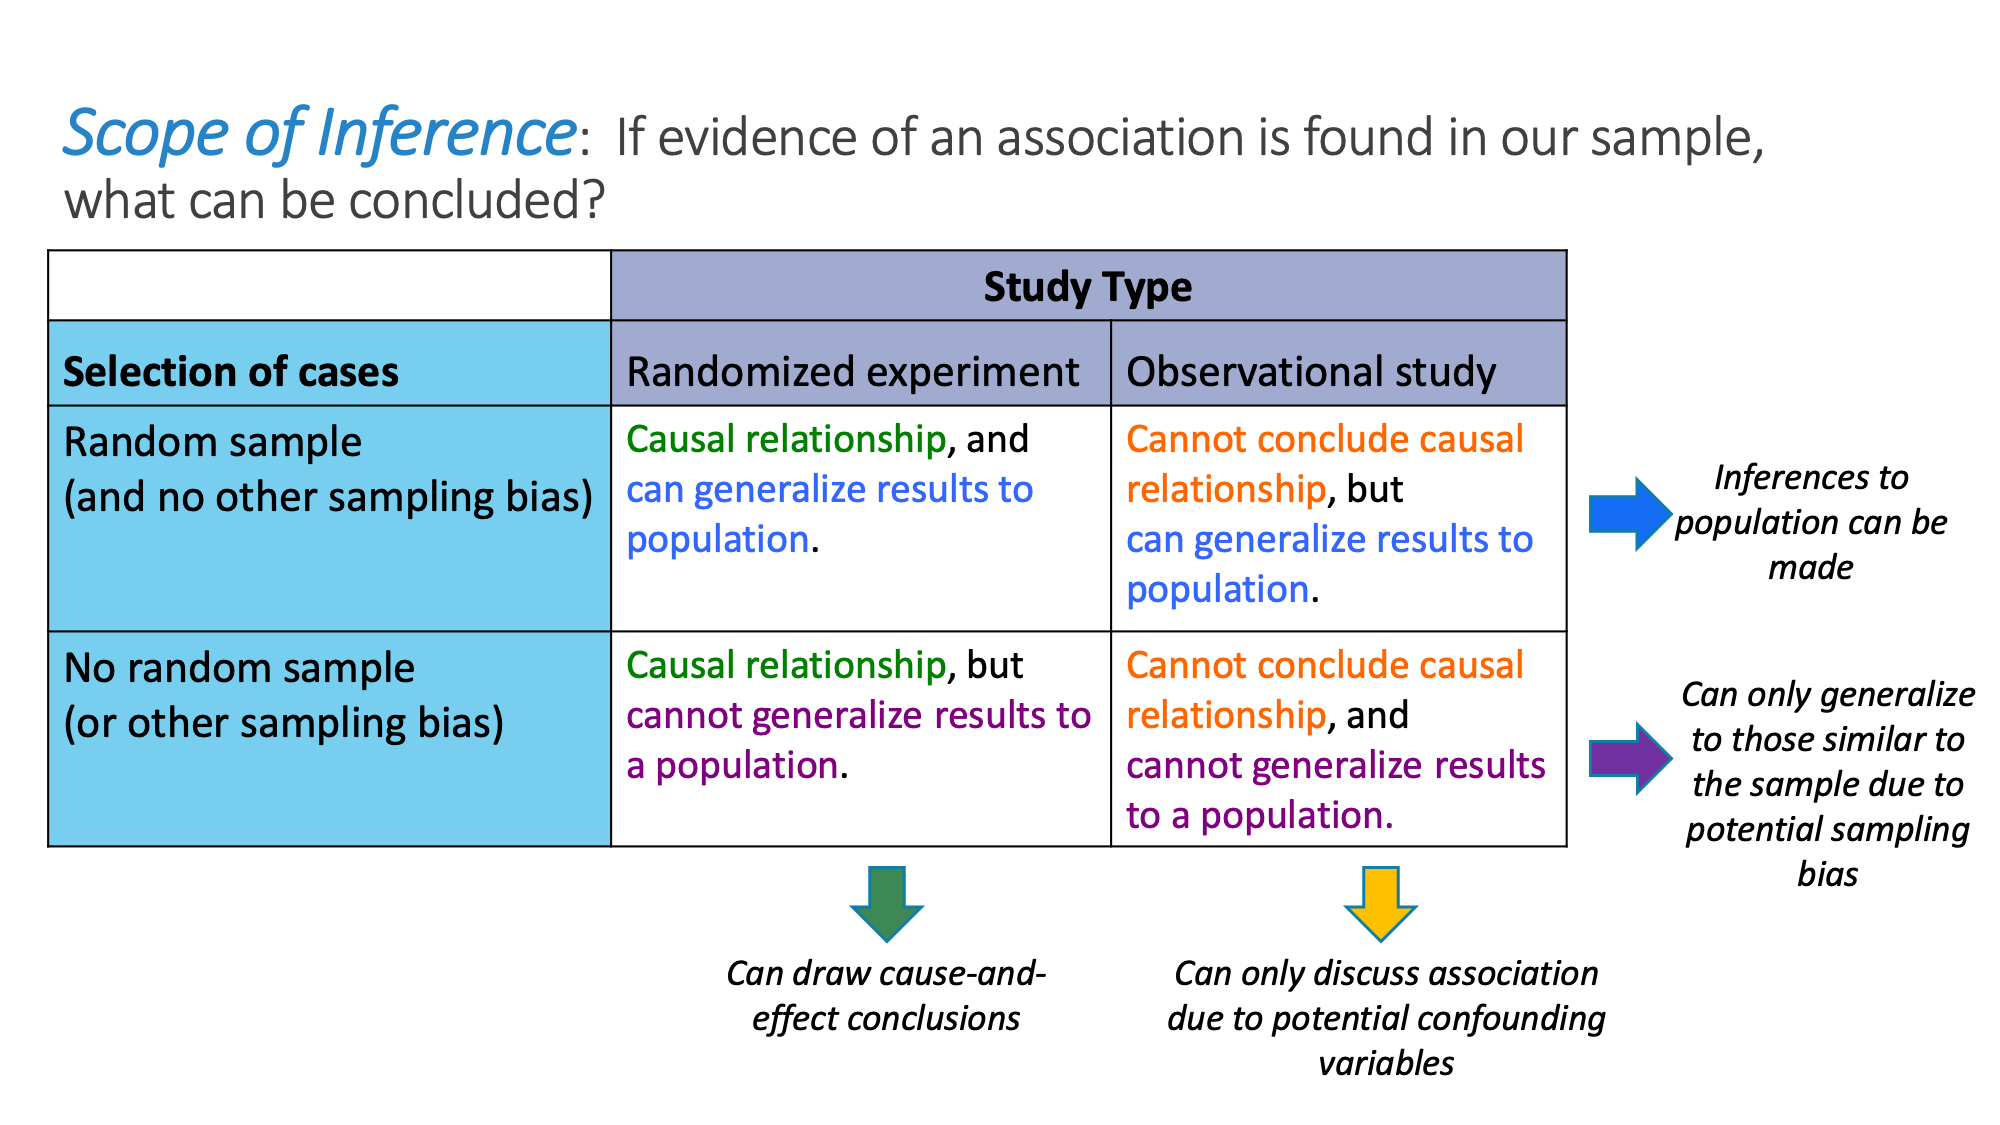
Scope of Inference:
| Method | Random Sampling? | Random Assignment? | Conclusions Possible |
|---|---|---|---|
| Observational Study | Yes | No | Generalization only, not causation |
| Experiment with Volunteers | No | Yes | Causation within study group, not generalization |
| Experiment with Random Sample | Yes | Yes | Both causation and generalization |
| Survey with Random Sample | Yes | No | Generalization, but no causation |
Example
Researchers randomly assign patients to either a new drug or a placebo. The drug group has significantly lower cholesterol (p-value = 0.01). What conclusions can be made?
▶️ Answer / Explanation
Step 1: Random assignment means causation is valid.
Step 2: P-value = 0.01 → strong evidence against chance explanation.
Step 3: If patients are representative of a larger population, results can generalize.
Conclusion: The new drug causes lower cholesterol, and results generalize if sample was random.
Example
In a national survey, 1500 randomly selected adults are asked about screen time and sleep quality. Results show a strong negative association. Can causation be concluded?
▶️ Answer / Explanation
Step 1: Random sampling allows generalization to the population.
Step 2: But no random assignment of treatments was done.
Conclusion: We can generalize the association to all adults, but we cannot conclude causation.
Example
A small experiment finds that participants who listen to music while studying score higher than those who don’t, but the p-value is 0.12. How should this be interpreted?
▶️ Answer / Explanation
Step 1: Random assignment allows causal conclusions in principle.
Step 2: But p-value = 0.12 → results are not statistically significant.
Conclusion: Evidence is insufficient to claim music improves studying. This may be a Type II error (failing to detect a real effect), possibly due to small sample size.