
3.8.A.1 Type I Error
A Type I error occurs when a hypothesis test provides convincing statistical evidence that the alternative hypothesis (\(H_a\)) is true (usually because the p-value is small), causing us to reject the null hypothesis (\(H_0\)), when in reality the null hypothesis is actually true.

In other words, a Type I error means that we conclude there is an effect, difference, or relationship when none actually exists.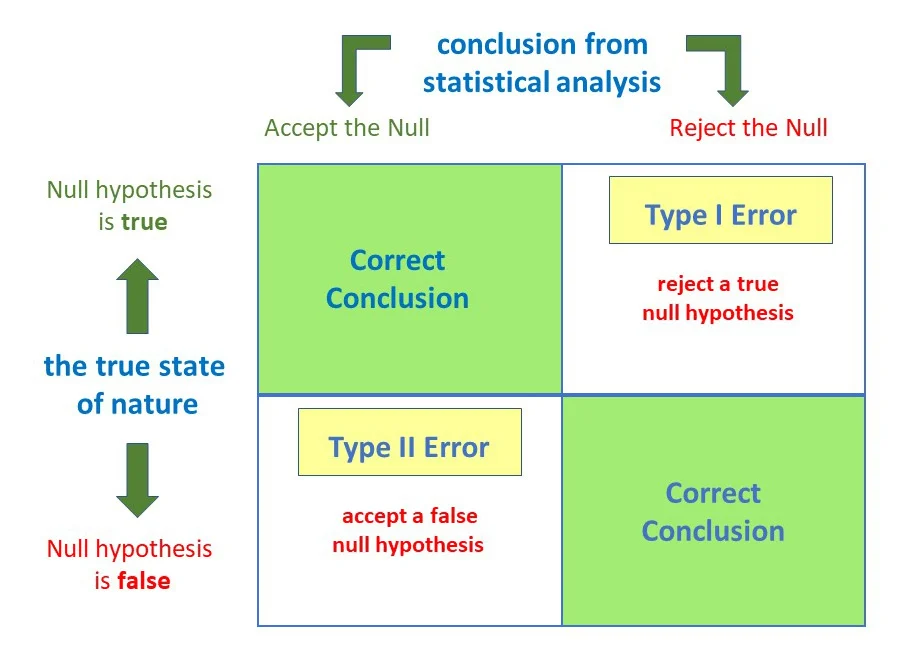
Definition
Type I Error = Rejecting a true null hypothesis.
Symbolically,
\(H_0\) is true, but we reject \(H_0\).
Decision Table
| Reality | Decision | Result |
|---|---|---|
| \(H_0\) is true | Reject \(H_0\) | Type I Error |
Why Does a Type I Error Occur?
- The sample provides unusually strong evidence against the null hypothesis.
- The p-value is less than the significance level (\(\alpha\)).
- However, this evidence is misleading because the null hypothesis is actually true.
This is sometimes called a false positive because we incorrectly conclude that an effect exists.
Relationship to the Significance Level
The probability of making a Type I error is represented by
\( \alpha \)
where \(\alpha\) is the significance level chosen before conducting the hypothesis test.
For example:
- \(\alpha = 0.05\) means there is a 5% chance of committing a Type I error.
- \(\alpha = 0.01\) means there is a 1% chance of committing a Type I error.
Example
A pharmaceutical company tests a new medication.
Hypotheses
- \(H_0:\) The medication has no effect.
- \(H_a:\) The medication is effective.
The study produces a very small p-value, so researchers reject \(H_0\).
Later, it is discovered that the medication actually has no effect.
This is a Type I Error.
The researchers concluded that the medication works when it actually does not.
Real-World Examples
| Situation | Type I Error |
|---|---|
| Medical Test | A healthy patient is incorrectly diagnosed as having the disease. |
| Court Trial | An innocent person is found guilty. |
| Manufacturing | A product that meets quality standards is incorrectly rejected as defective. |
Important AP Exam Notes
- A Type I error occurs when a true null hypothesis is rejected.
- It means there is convincing statistical evidence for the alternative hypothesis when the alternative is actually false.
- The probability of a Type I error equals the significance level, \(\alpha\).
- A Type I error is often called a false positive.
- Always describe a Type I error in the context of the problem.
Common AP Exam Mistakes
| Incorrect | Correct |
|---|---|
| A Type I error means accepting a false null hypothesis. | A Type I error means rejecting a true null hypothesis. |
| Confusing Type I and Type II errors. | Type I = Reject a true \(H_0\); Type II = Fail to reject a false \(H_0\). |
| Describing the error without referring to the context. | Always explain the error using the study’s variables and population. |
Example
A researcher wants to determine whether a new fertilizer increases the average height of tomato plants.
Hypotheses
\(H_0:\mu=40\) cm (The fertilizer does not increase the average height.)
\(H_a:\mu>40\) cm (The fertilizer increases the average height.)
The researcher rejects \(H_0\).
Describe a Type I error in the context of this study.
▶️ Answer / Explanation
A Type I error would occur if the researcher concludes that the fertilizer increases the average height of tomato plants when, in reality, it does not increase the average height.
In other words, the researcher incorrectly rejects a true null hypothesis.
3.8.A.2 Type II Error
A Type II error occurs when a hypothesis test does not provide convincing statistical evidence that the alternative hypothesis (\(H_a\)) is true (usually because the p-value is large), causing us to fail to reject the null hypothesis (\(H_0\)), when in reality the null hypothesis is actually false.

In other words, a Type II error means that we fail to detect an effect, difference, or relationship that actually exists.
Definition
Type II Error = Failing to reject a false null hypothesis.
Symbolically,
\(H_0\) is false, but we fail to reject \(H_0\).
Decision Table
| Reality | Decision | Result |
|---|---|---|
| \(H_0\) is false | Fail to reject \(H_0\) | Type II Error |
Why Does a Type II Error Occur?
- The sample does not provide enough statistical evidence against the null hypothesis.
- The p-value is greater than the significance level (\(\alpha\)).
- However, the null hypothesis is actually false.
This is sometimes called a false negative because we incorrectly conclude that there is no effect when an effect actually exists.
Probability of a Type II Error
The probability of making a Type II error is represented by
\( \beta \)
The value of \( \beta \) depends on several factors, including:
- The true value of the population parameter.
- The sample size.
- The variability in the data.
- The significance level (\(\alpha\)).
Unlike a Type I error, the probability of a Type II error is not predetermined.
Example
A pharmaceutical company tests a new medication.
Hypotheses
- \(H_0:\) The medication has no effect.
- \(H_a:\) The medication is effective.
The study produces a large p-value, so researchers fail to reject \(H_0\).
Later, additional research shows that the medication actually is effective.
This is a Type II Error.
The researchers failed to detect a treatment that truly works.
Real-World Examples
| Situation | Type II Error |
|---|---|
| Medical Test | A patient with the disease is incorrectly told they do not have it. |
| Court Trial | A guilty person is found not guilty. |
| Manufacturing | A defective product is incorrectly accepted as meeting quality standards. |
Type I Error vs. Type II Error

| Type I Error | Type II Error |
|---|---|
| Reject a true \(H_0\). | Fail to reject a false \(H_0\). |
| False positive. | False negative. |
| Probability = \(\alpha\). | Probability = \(\beta\). |
Important AP Exam Notes
- A Type II error occurs when a false null hypothesis is not rejected.
- It means there is not convincing statistical evidence for the alternative hypothesis even though the alternative hypothesis is actually true.
- The probability of a Type II error is denoted by \(\beta\).
- A Type II error is often called a false negative.
- Always describe a Type II error in the context of the problem.
Common AP Exam Mistakes
| Incorrect | Correct |
|---|---|
| A Type II error means rejecting a true null hypothesis. | A Type II error means failing to reject a false null hypothesis. |
| Failing to reject \(H_0\) means \(H_0\) is true. | Failing to reject \(H_0\) only means there is insufficient evidence against it. |
| Describing the error without referring to the context. | Always explain the error using the study’s variables and population. |
Example
A researcher wants to determine whether a new fertilizer increases the average height of tomato plants.
Hypotheses
\(H_0:\mu=40\) cm (The fertilizer does not increase the average height.)
\(H_a:\mu>40\) cm (The fertilizer increases the average height.)
The researcher fails to reject \(H_0\).
Describe a Type II error in the context of this study.
▶️ Answer / Explanation
A Type II error would occur if the researcher concludes that there is not enough evidence to say the fertilizer increases the average height of tomato plants when, in reality, the fertilizer does increase the average height.
In other words, the researcher fails to reject a false null hypothesis.
3.8.A.3 Power of a Hypothesis Test
The power of a hypothesis test is the probability that the test will correctly reject a false null hypothesis.
In other words, power measures how likely a hypothesis test is to detect a real effect, difference, or relationship when one actually exists.
A hypothesis test with high power is more likely to identify a false null hypothesis and produce the correct conclusion.
Definition
Power = Probability of correctly rejecting a false null hypothesis.
Symbolically,
Power = \(1-\beta\)
where:
- \(\beta\) = Probability of a Type II error.
- \(1-\beta\) = Probability of correctly rejecting a false null hypothesis.
Relationship Between Power and Type II Error
| Concept | Meaning |
|---|---|
| Type II Error | Failing to reject a false null hypothesis. |
| Power | Correctly rejecting a false null hypothesis. |
| Relationship | \( \text{Power}=1-\beta \) |
Interpreting Power
- High power means the test is more likely to detect a true effect.
- Low power means the test is more likely to miss a true effect, increasing the chance of a Type II error.
- Researchers generally prefer tests with power of at least 0.80 (80%).
Factors That Increase Power
| Factor | Effect on Power | Reason |
|---|---|---|
| Larger sample size (\(n\)) | Increases | Produces more precise estimates and reduces sampling variability. |
| Larger significance level (\(\alpha\)) | Increases | Makes it easier to reject \(H_0\). |
| Larger true effect size | Increases | The true difference is easier to detect. |
| Lower variability (smaller \(\sigma\)) | Increases | Data are less spread out, making differences easier to identify. |
Example
A researcher wants to determine whether a new teaching method improves students’ average test scores.
Hypotheses
- \(H_0:\mu=75\)
- \(H_a:\mu>75\)
Suppose the new teaching method actually increases the average score to 80.
If the hypothesis test correctly rejects \(H_0\), then the test has successfully detected the true improvement.
This correct decision is an example of the power of the hypothesis test.
Decision Outcomes
| Reality | Decision | Result |
|---|---|---|
| \(H_0\) is true | Reject \(H_0\) | Type I Error |
| \(H_0\) is true | Fail to reject \(H_0\) | Correct Decision |
| \(H_0\) is false | Reject \(H_0\) | Power |
| \(H_0\) is false | Fail to reject \(H_0\) | Type II Error |
Important AP Exam Notes
- The power of a hypothesis test is the probability of correctly rejecting a false null hypothesis.
- Power is equal to \(1-\beta\), where \(\beta\) is the probability of a Type II error.
- A higher power means the test is more likely to detect a real effect.
- Increasing the sample size generally increases the power of a hypothesis test.
- Power and Type II error are complementary probabilities.
Common AP Exam Mistakes
| Incorrect | Correct |
|---|---|
| Power is the probability of rejecting a true null hypothesis. | That is a Type I error. Power is rejecting a false null hypothesis. |
| Power equals \(\beta\). | Power = \(1-\beta\). |
| Increasing sample size decreases power. | Increasing sample size generally increases power. |
Example
A researcher is testing whether a new exercise program lowers the average resting heart rate of adults.
Hypotheses
\(H_0:\mu=70\) beats per minute
\(H_a:\mu<70\) beats per minute
Suppose the true average resting heart rate after following the program is 66 beats per minute.
Explain what the power of the hypothesis test means in this context.
▶️ Answer / Explanation
The power of the hypothesis test is the probability that the test will correctly reject the null hypothesis and conclude that the exercise program lowers the average resting heart rate when it truly does.
In other words, it is the probability of detecting the real improvement produced by the exercise program.
3.8.B.1 Probability of a Type I Error
The probability of making a Type I error is called the significance level, denoted by
\( \alpha \)
A Type I error occurs when we reject the null hypothesis (\(H_0\)) even though it is actually true.
Before collecting data, the researcher chooses the significance level (\(\alpha\)), which determines the maximum acceptable probability of making a Type I error.
Definition
\(\boxed{\text{Probability of a Type I Error}=\alpha}\)
The significance level is selected before conducting the hypothesis test.
Common significance levels are:
- \(\alpha=0.10\)
- \(\alpha=0.05\)
- \(\alpha=0.01\)
Relationship Between \(\alpha\) and Type I Error
| Significance Level (\(\alpha\)) | Meaning |
|---|---|
| 0.10 | 10% chance of making a Type I error. |
| 0.05 | 5% chance of making a Type I error. |
| 0.01 | 1% chance of making a Type I error. |
Why Is \(\alpha\) Chosen Before the Study?
The researcher chooses \(\alpha\) before collecting data to control the risk of incorrectly rejecting a true null hypothesis.
- A smaller \(\alpha\) reduces the chance of making a Type I error.
- A larger \(\alpha\) increases the chance of making a Type I error.
This choice reflects how much risk the researcher is willing to accept.
Example 1
A pharmaceutical company is testing a new medication.
The researchers conduct a hypothesis test using
\(\alpha=0.05\)
Interpretation
If the medication actually has no effect, there is a 5% probability that the researchers will incorrectly reject the null hypothesis and conclude that the medication is effective.
This is the probability of making a Type I error.
Example 2
A manufacturer tests whether a machine is producing defective parts.
The significance level is
\(\alpha=0.01\)
Interpretation
There is a 1% probability of incorrectly concluding that the machine is defective when it is actually functioning properly.
Summary Table
| Concept | Value |
|---|---|
| Probability of Type I Error | \( \alpha \) |
| Chosen | Before collecting data |
| Typical Values | 0.10, 0.05, 0.01 |
Important AP Exam Notes
- The probability of making a Type I error is exactly equal to the significance level (\(\alpha\)).
- The researcher selects \(\alpha\) before collecting data.
- Common significance levels are 0.10, 0.05, and 0.01.
- Smaller values of \(\alpha\) decrease the probability of making a Type I error.
- Always interpret the probability of a Type I error in the context of the study.
Common AP Exam Mistakes
| Incorrect | Correct |
|---|---|
| \(\alpha\) is the probability that the null hypothesis is true. | \(\alpha\) is the probability of making a Type I error. |
| \(\alpha\) is determined after calculating the p-value. | \(\alpha\) is chosen before data are collected. |
| A smaller \(\alpha\) increases the chance of a Type I error. | A smaller \(\alpha\) decreases the chance of a Type I error. |
Example
A food company is testing whether a new packaging process increases the shelf life of its products.
The hypothesis test is conducted using a significance level of
\(\alpha=0.01\)
Interpret the probability of making a Type I error in the context of this study.
▶️ Answer / Explanation
A significance level of 0.01 means there is a 1% probability of concluding that the new packaging process increases the shelf life of the products when, in reality, it does not increase the shelf life.
This is the probability of making a Type I error.
3.8.C.1 Factors That Affect Type II Error and Power
For a given hypothesis test, researchers aim to:
- Keep the probability of a Type II error (\(\beta\)) as small as possible.

- Make the power of the test as large as possible.
Since
\( \text{Power}=1-\beta \)
reducing the probability of a Type II error automatically increases the power of the hypothesis test.
For example, if
\(P(\text{Type II Error})=\beta=0.20\)
then
\(\text{Power}=1-0.20=0.80\)
This means the test correctly rejects a false null hypothesis 80% of the time.
Factors That Increase Power (and Decrease Type II Error)
Provided all other factors remain constant, the probability of a Type II error decreases and the power increases when:
| Factor | Effect on Power | Reason |
|---|---|---|
| Increase the sample size (\(n\)) | Power increases | Larger samples provide more precise estimates and make real differences easier to detect. |
| Decrease the standard error (SE) | Power increases | Less sampling variability makes the test statistic more sensitive to real differences. |
| Increase the true effect size (True parameter is farther from \(H_0\)) | Power increases | Larger differences are easier for the hypothesis test to detect. |
| Increase the significance level (\(\alpha\)) | Power increases | It becomes easier to reject the null hypothesis. |
Explanation of Each Factor
1. Increasing the Sample Size
- A larger sample provides more information about the population.
- The sampling distribution becomes less variable.
- This makes it easier to detect a true effect.
- Therefore, power increases and Type II error decreases.
2. Decreasing the Standard Error
The standard error is
\(SE=\dfrac{\sigma}{\sqrt{n}}\)
When the standard error becomes smaller:
- The sampling distribution is less spread out.
- The test statistic is more likely to fall into the rejection region if the null hypothesis is false.
- Power increases.
3. Increasing the True Effect Size
The farther the true population parameter is from the null hypothesis value, the easier it is for the hypothesis test to detect the difference.
Small differences are harder to detect than large differences.
4. Increasing the Significance Level (\(\alpha\))
A larger significance level increases the rejection region.
This makes rejecting the null hypothesis easier.
As a result:
- Power increases.
- Type II error decreases.
- However, the probability of a Type I error increases.
Important AP Exam Notes
- Power is the probability of correctly rejecting a false null hypothesis.
- \(\text{Power}=1-\beta\).
- Increasing the sample size increases power.
- Decreasing the standard error increases power.
- A larger true effect size increases power.
- Increasing the significance level (\(\alpha\)) increases power, but it also increases the probability of a Type I error.
Common AP Exam Mistakes
| Incorrect | Correct |
|---|---|
| Increasing \(\alpha\) decreases power. | Increasing \(\alpha\) increases power. |
| A larger sample size increases Type II error. | A larger sample size decreases Type II error. |
| Power and Type II error are unrelated. | Power and Type II error are complements: \( \text{Power}=1-\beta \). |
Example
A researcher wants to increase the power of a hypothesis test while keeping all other factors constant.
Which of the following changes would increase the power?
- Increase the sample size.
- Decrease the significance level from 0.05 to 0.01.
- Decrease the standard error.
- Increase the true difference between the population parameter and the null hypothesis value.
▶️ Answer / Explanation
The correct choices are:
- Increase the sample size.
- Decrease the standard error.
- Increase the true effect size (true parameter farther from the null value).
Choice 2 is incorrect because decreasing the significance level makes it harder to reject the null hypothesis, which decreases the power.
3.8.D.1 Interpreting Type I and Type II Errors
The consequences of making a Type I error and a Type II error are not always equally serious.
- Depending on the context of the study, one type of error may have much greater consequences than the other.
- Therefore, researchers should carefully consider the consequences of both errors before conducting the study.
Key Idea
There is no universal rule stating that one type of error is always worse.
- In some situations, a Type I error has more serious consequences.
- In other situations, a Type II error has more serious consequences.
The seriousness depends entirely on the context of the problem.
Review of the Two Errors
| Error Type | Definition |
|---|---|
| Type I Error | Rejecting a true null hypothesis (false positive). |
| Type II Error | Failing to reject a false null hypothesis (false negative). |
Example 1: Medical Testing
A new medical test is being evaluated for detecting a serious disease.
Hypotheses
- \(H_0:\) The patient does not have the disease.
- \(H_a:\) The patient has the disease.
| Error | Interpretation |
|---|---|
| Type I Error | A healthy patient is incorrectly diagnosed as having the disease. |
| Type II Error | A patient with the disease is incorrectly told they are healthy. |
In this situation, a Type II error may be more serious because the patient may not receive necessary treatment.
Example 2: Criminal Trial
Hypotheses
\(H_0:\) The defendant is innocent.
\(H_a:\) The defendant is guilty.
| Error | Interpretation |
|---|---|
| Type I Error | An innocent person is convicted. |
| Type II Error | A guilty person is found not guilty. |
In many legal systems, a Type I error is considered more serious because convicting an innocent person is viewed as a greater injustice.
Example 3: Manufacturing
A factory tests whether a product is defective.
| Error | Interpretation |
|---|---|
| Type I Error | A good product is discarded. |
| Type II Error | A defective product is shipped to customers. |
Depending on the product, a Type II error may be much more serious because defective products could harm customers.
Why Researchers Consider Error Consequences
Before conducting a hypothesis test, researchers evaluate:
- Which error would cause greater harm.
- How much risk of each error is acceptable.
- Whether changes to the study design are needed to reduce the more serious error.
Important AP Exam Notes
- Neither Type I nor Type II errors are always more serious.
- The seriousness of each error depends on the context of the study.
- Researchers should evaluate the consequences of both errors before collecting data.
- On the AP Statistics Exam, always describe Type I and Type II errors using the context provided.
- When asked which error is more serious, justify your answer based on the real-world consequences.
Common AP Exam Mistakes
| Incorrect | Correct |
|---|---|
| Type I errors are always worse. | The more serious error depends on the context. |
| Type II errors are always worse. | The seriousness varies by situation. |
| Explaining the error without context. | Always interpret the error using the specific study. |
Example
A university is testing whether a new tutoring program improves students’ average AP Statistics scores.
Hypotheses
\(H_0:\) The tutoring program does not improve average scores.
\(H_a:\) The tutoring program improves average scores.
Which error would likely have the more serious consequence? Explain.
▶️ Answer / Explanation
Reasonable answers may vary depending on the justification.
One possible answer is that a Type II error is more serious because the university would fail to recognize that the tutoring program is actually effective and might choose not to implement a program that could benefit future students.
Another reasonable answer could argue that a Type I error is more serious if implementing an ineffective tutoring program would require significant time and financial resources.
The key is to justify the answer using the context of the study.
3.8.D.2 Choosing the Significance Level Based on the Consequences of a Type I Error
The significance level, denoted by \( \alpha \), is the probability of making a Type I error.
Because a Type I error may have serious real-world consequences, researchers should consider those consequences when selecting the significance level before collecting data.
Key Idea
Since
\(\boxed{P(\text{Type I Error})=\alpha}\)
the seriousness of a Type I error influences how small or large the significance level should be.
- If a Type I error would be very serious, choose a smaller significance level.
- If a Type I error is less serious, a larger significance level may be acceptable.
Relationship Between Type I Error and Significance Level
| Consequence of Type I Error | Recommended Significance Level |
|---|---|
| Very serious | Choose a small \(\alpha\) (such as 0.01). |
| Moderately serious | Choose a moderate \(\alpha\) (such as 0.05). |
| Less serious | A larger \(\alpha\) (such as 0.10) may be acceptable. |
Example
A pharmaceutical company is testing whether a new medication is effective.
A Type I error would mean approving a medication that actually does not work.
Because this could affect many patients, researchers might choose
\(\alpha=0.01\)
to greatly reduce the probability of making a Type I error.
Important AP Exam Notes
- The significance level (\(\alpha\)) is chosen before data collection.
- \(\alpha\) is the probability of making a Type I error.
- More serious Type I errors generally require a smaller significance level.
- Reducing \(\alpha\) lowers the chance of a Type I error but may increase the chance of a Type II error.
3.8.D.3 Choosing Sample Size Based on the Consequences of a Type II Error
The probability of making a Type II error depends partly on the sample size.
If a Type II error would have serious consequences, researchers often choose a larger sample size to reduce the probability of making that error and increase the power of the hypothesis test.
Key Idea
A larger sample size decreases sampling variability, making it easier to detect a true effect.
This results in:
- Lower probability of a Type II error (\(\beta\)).
- Higher power (\(1-\beta\)).
Relationship Between Type II Error and Sample Size
| Consequence of Type II Error | Recommended Sample Size |
|---|---|
| Very serious | Use a larger sample size to increase power. |
| Less serious | A smaller sample size may be acceptable. |
Example
A medical researcher is testing whether a new cancer treatment improves survival.
- A Type II error would mean failing to detect a treatment that actually saves lives.
- Because this consequence is very serious, researchers would typically collect a large sample to reduce the probability of a Type II error and increase the power of the study.
Common AP Exam Mistakes
| Incorrect | Correct |
|---|---|
| Choosing a larger \(\alpha\) when Type I errors are very serious. | Choose a smaller \(\alpha\) to reduce the probability of a Type I error. |
| Using a smaller sample size when Type II errors are very serious. | Use a larger sample size to reduce Type II error and increase power. |
| Thinking sample size affects only Type I error. | Sample size mainly affects Type II error and power. |
Example
A company is testing whether a new automobile airbag reduces injuries in crashes.
(a) If approving an ineffective airbag would put drivers at risk, what should the company do with the significance level?
(b) If failing to detect an effective airbag would also have serious consequences, what should the company do with the sample size?
▶️ Answer / Explanation
(a) The company should choose a smaller significance level (such as \(\alpha=0.01\)) to reduce the probability of making a Type I error.
(b) The company should use a larger sample size to reduce the probability of making a Type II error and increase the power of the hypothesis test.