
4.1.A.1 Mean and Standard Deviation of the Sampling Distribution of the Sample Mean
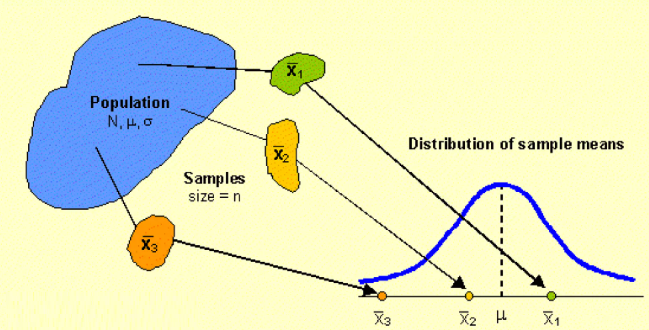
When random samples of the same size are repeatedly selected from a population, each sample has its own sample mean, denoted by \( \bar{x} \).
The collection of all possible sample means forms the sampling distribution of the sample mean.
If the sampled values are independent, then the sampling distribution has its own mean and standard deviation.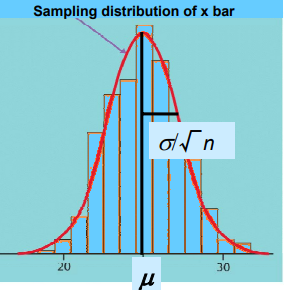
Mean of the Sampling Distribution
The mean of the sampling distribution of the sample mean is equal to the population mean.
\( \mu_{\bar{x}}=\mu \)
Standard Deviation of the Sampling Distribution
The standard deviation of the sampling distribution of the sample mean is called the standard error of the mean.
It is equal to the population standard deviation divided by the square root of the sample size.
\( \sigma_{\bar{x}}=\dfrac{\sigma}{\sqrt{n}} \)
Where:
- \( \mu_{\bar{x}} \) = Mean of the sampling distribution of the sample mean
- \( \mu \) = Population mean
- \( \sigma_{\bar{x}} \) = Standard deviation of the sampling distribution (standard error)
- \( \sigma \) = Population standard deviation
- \( n \) = Sample size
As the sample size increases, the standard deviation of the sampling distribution becomes smaller. This means that sample means tend to vary less and become more concentrated around the population mean.
| Quantity | Formula | Interpretation |
|---|---|---|
| Mean of Sampling Distribution | \( \mu_{\bar{x}}=\mu \) | The average of all possible sample means equals the population mean. |
| Standard Deviation of Sampling Distribution | \( \sigma_{\bar{x}}=\dfrac{\sigma}{\sqrt{n}} \) | Measures the variability of the sample means around the population mean. |
Important AP Exam Notes
- The formulas apply when the sampled observations are independent.
- The mean of the sampling distribution is always equal to the population mean.
- The standard deviation of the sampling distribution is called the standard error.
- As the sample size \(n\) increases, \( \sigma_{\bar{x}} \) decreases because it is divided by \( \sqrt{n} \).
- The sampling distribution is generally less variable than the original population.
Example
A population has a mean of \( \mu=80 \) and a population standard deviation of \( \sigma=12 \)
Random samples of size \( n=36 \) are selected independently.
Calculate the mean and standard deviation of the sampling distribution of the sample mean.
▶️ Answer / Explanation
Step 1: Calculate the mean of the sampling distribution.
\( \mu_{\bar{x}}=\mu=80 \)
Step 2: Calculate the standard deviation of the sampling distribution.
\( \sigma_{\bar{x}}=\dfrac{\sigma}{\sqrt{n}} \)
\( =\dfrac{12}{\sqrt{36}} \)
\( =\dfrac{12}{6} \)
\( =2 \)
Answer:
- Mean of the sampling distribution: \(80\)
- Standard deviation of the sampling distribution: \(2\)
4.1.B.1 Conditions for the Sampling Distribution of a Sample Mean
Before using the sampling distribution of the sample mean, statisticians must verify that the required conditions are satisfied.
When sampling is done without replacement, two important conditions must be checked:
- The Randomization Condition
- The 10% Condition
4.1.B.1.i Randomization Condition
The Randomization Condition requires that the data be collected using a random sample.
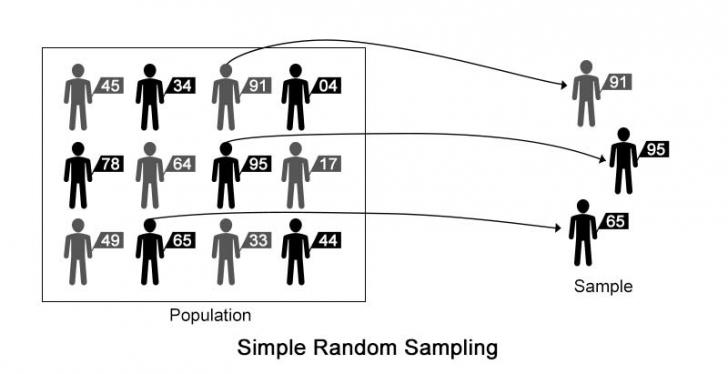
Random sampling gives every individual in the population an equal chance of being selected. This helps reduce bias and allows the sample to represent the population.
If the sample is not selected randomly, the sampling distribution may not accurately represent the population.
How to Check the Randomization Condition
- Verify that the problem states the sample was selected randomly.
- Look for phrases such as “simple random sample (SRS)”, “random sample”, or “randomly selected”.
4.1.B.1.ii 10% Condition
When sampling is done without replacement, observations are no longer completely independent because selecting one individual changes the population slightly.
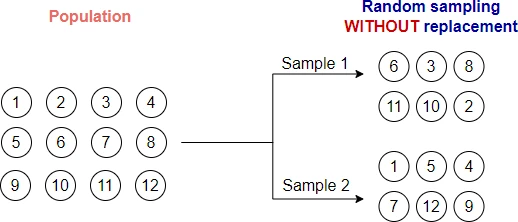
To treat the sampled observations as approximately independent, the population should be at least 10 times larger than the sample.
This requirement is called the 10% Condition.
Formula
\( n \leq 0.10N \)
or equivalently
\( N \geq 10n \)
Where:
- \(N\) = Population size
- \(n\) = Sample size
If this condition is satisfied, the sampled observations can be treated as approximately independent.
| Condition | Requirement | Purpose |
|---|---|---|
| Randomization Condition | The sample must be selected randomly. | Reduces bias and produces a representative sample. |
| 10% Condition | \( N \geq 10n \) | Ensures observations are approximately independent when sampling without replacement. |
Important AP Exam Notes
- Both the Randomization Condition and the 10% Condition should be checked when sampling is done without replacement.
- The Randomization Condition is satisfied only if the sample was selected randomly.
- The 10% Condition applies only when sampling is performed without replacement.
- When justifying conditions on the AP Exam, always state whether each condition is satisfied and explain why.
Example
A researcher randomly selects 80 students from a high school with a total enrollment of 1,500 students. The students are selected without replacement.
Determine whether the Randomization Condition and the 10% Condition are satisfied.
▶️ Answer / Explanation
Step 1: Check the Randomization Condition.
The problem states that the students were randomly selected.
Therefore, the Randomization Condition is satisfied.
Step 2: Check the 10% Condition.
The population size is
\( N=1500 \)
The sample size is
\( n=80 \)
Check the condition:
\( 10n=10(80)=800 \)
Since
\( 1500 \geq 800 \)
the 10% Condition is satisfied.
Conclusion: Both required conditions are satisfied, so the sampled observations can be treated as approximately independent.
4.1.B.2 Normal Population Condition
To determine whether the sampling distribution of the sample mean can be modeled using a normal distribution, statisticians consider the shape of the population distribution.
If the population distribution is normally distributed, then the sampling distribution of the sample mean is also normally distributed, regardless of the sample size.
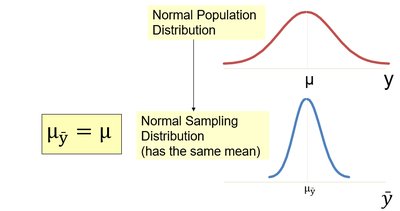
This means that even if the sample size is small, the sampling distribution of the sample mean will follow a normal distribution as long as the population itself is normal.
Condition
If the population distribution is normal, then
The sampling distribution of \( \bar{x} \) is Normal for any sample size.
This result applies whether the sample size is:
- Small (\(n<30\))
- Moderate
- Large (\(n\ge30\))
| Population Distribution | Sample Size | Sampling Distribution of \( \bar{x} \) |
|---|---|---|
| Normal | Any value of \(n\) | Normal |
Why Does This Matter?
- A normal sampling distribution allows statisticians to use probability methods and construct confidence intervals.
- No minimum sample size is required when the population distribution is normal.
- This condition simplifies many statistical procedures involving sample means.
Important AP Exam Notes
- If the population distribution is stated to be normal, you may conclude that the sampling distribution of the sample mean is also normal, regardless of the sample size.
- You do not need \(n\ge30\) when the population is normally distributed.
- Always mention that the population distribution is normal when justifying the use of a normal model.
Example
The heights of adult women in a city are known to follow a normal distribution with mean \(165\) cm and standard deviation \(6\) cm.
A random sample of 16 women is selected.
Can the sampling distribution of the sample mean be modeled using a normal distribution? Justify your answer.
▶️ Answer / Explanation
Yes.
The population distribution of women’s heights is stated to be normally distributed.
Therefore, the sampling distribution of the sample mean, \( \bar{x} \), is also normally distributed, regardless of the sample size.
Even though the sample size is only
\( n=16 \)
the Normal Population Condition is satisfied because the population itself is normal.
4.1.B.3 Large Sample Condition (Central Limit Theorem)
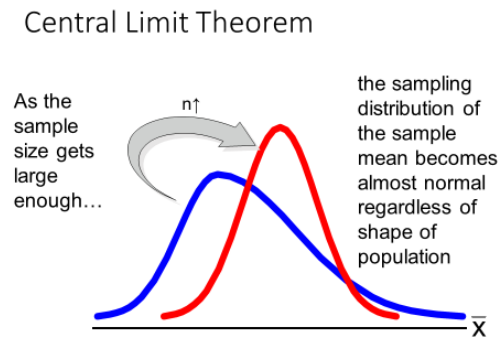
If the population distribution cannot be modeled by a normal distribution, the sampling distribution of the sample mean may still be approximately normal if the sample size is sufficiently large.
This result is a consequence of the Central Limit Theorem (CLT).
The Central Limit Theorem states that as the sample size increases, the sampling distribution of the sample mean becomes approximately normal, even if the population distribution is not normal.
Condition
If the population distribution is not normal, then the sampling distribution of the sample mean can be modeled approximately by a normal distribution provided
\( n \geq 30 \)
However, if the population distribution is extremely skewed or contains strong outliers, a sample size much larger than 30 may be required before the sampling distribution is approximately normal.
| Population Distribution | Sample Size | Sampling Distribution of \( \bar{x} \) |
|---|---|---|
| Not Normal | \( n \geq 30 \) | Approximately Normal |
| Extremely Skewed | Much larger than 30 | Approximately Normal if the sample size is sufficiently large. |
Important AP Exam Notes
- This condition is based on the Central Limit Theorem (CLT).
- If the population is not normal, check whether \( n \geq 30 \).
- If the population is extremely skewed, a sample size greater than 30 may still be required.
- As the sample size increases, the sampling distribution of the sample mean becomes more nearly normal.
- Always justify why the sampling distribution is approximately normal using the sample size and the shape of the population distribution.
Example
A population of household incomes is strongly right-skewed.
A random sample of 50 households is selected.
Can the sampling distribution of the sample mean be modeled approximately by a normal distribution? Justify your answer.
▶️ Answer / Explanation
The population distribution is not normal because it is right-skewed.
However, the sample size is
\( n=50 \)
Since
\( 50 \geq 30 \)
the Central Limit Theorem applies.
Therefore, the sampling distribution of the sample mean can be modeled approximately by a normal distribution.
Note: If the population were extremely skewed, an even larger sample size might be needed to ensure the sampling distribution is approximately normal.
4.1.C.1 Interpreting the Mean, Standard Deviation, and Probabilities of a Sampling Distribution
After determining the sampling distribution of the sample mean, statisticians interpret its mean, standard deviation, and probabilities in the context of the population being studied.
These interpretations should always refer to the sample mean, denoted by \( \bar{x} \), rather than an individual observation.
Mean of the Sampling Distribution
The mean of the sampling distribution is equal to the population mean.
\( \mu_{\bar{x}}=\mu \)
Interpretation:
The average of all possible sample means is equal to the population mean.
Standard Deviation of the Sampling Distribution
The standard deviation of the sampling distribution (also called the standard error) measures how much the sample means vary from one sample to another.
\( \sigma_{\bar{x}}=\dfrac{\sigma}{\sqrt{n}} \)
Interpretation:
The sample means typically differ from the population mean by approximately \( \sigma_{\bar{x}} \).
Probabilities
Probabilities calculated from the sampling distribution describe the likelihood that the sample mean falls within a specified interval.
These probabilities should always be interpreted in terms of sample means, not individual observations.
| Quantity | Interpretation |
|---|---|
| Mean (\( \mu_{\bar{x}} \)) | The average of all possible sample means equals the population mean. |
| Standard Deviation (\( \sigma_{\bar{x}} \)) | Measures the variability of the sample means around the population mean. |
| Probability | Describes the likelihood that the sample mean falls within a specified interval. |
Important AP Exam Notes
- Always interpret results in terms of the sample mean (\( \bar{x} \)), not individual observations.
- The mean of the sampling distribution refers to the average of all possible sample means.
- The standard deviation describes the variability of the sample means, not the variability of individual data values.
- Probability statements should always mention the sample mean and the population being studied.
- Include the context of the problem in every interpretation.
Example
A population of mathematics test scores has a mean of \( \mu=75 \) and a standard deviation of \( \sigma=15 \) Random samples of size \( n=25 \) are selected independently.
Suppose the probability that the sample mean exceeds 80 is \( P(\bar{x}>80)=0.048 \)
Interpret the mean, standard deviation, and probability of the sampling distribution.
▶️ Answer / Explanation
Mean:
The mean of the sampling distribution is
\( \mu_{\bar{x}}=75 \)
This means that the average of all possible sample means is 75 points.
Standard Deviation:
\( \sigma_{\bar{x}}=\dfrac{15}{\sqrt{25}}=\dfrac{15}{5}=3 \)
This means that the sample means typically vary by about 3 points from the population mean.
Probability:
The probability
\( P(\bar{x}>80)=0.048 \)
means that approximately 4.8% of all random samples of size 25 will have a sample mean mathematics test score greater than 80.