
4.10.A.1 Test Statistic for a Two-Sample t-Test
After stating the hypotheses and verifying the required conditions, the next step in a two-sample t-test is to calculate the test statistic.
The test statistic measures how many standard errors the observed difference between the sample means is from the difference stated in the null hypothesis.
For most AP Statistics problems, the null hypothesis states
\( H_0:\mu_1-\mu_2=0 \)
so the test statistic compares the observed sample difference with 0.
Test Statistic Formula
\( t=\dfrac{(\bar{x}_1-\bar{x}_2)-(\mu_1-\mu_2)}{\sqrt{\dfrac{s_1^2}{n_1}+\dfrac{s_2^2}{n_2}}} \)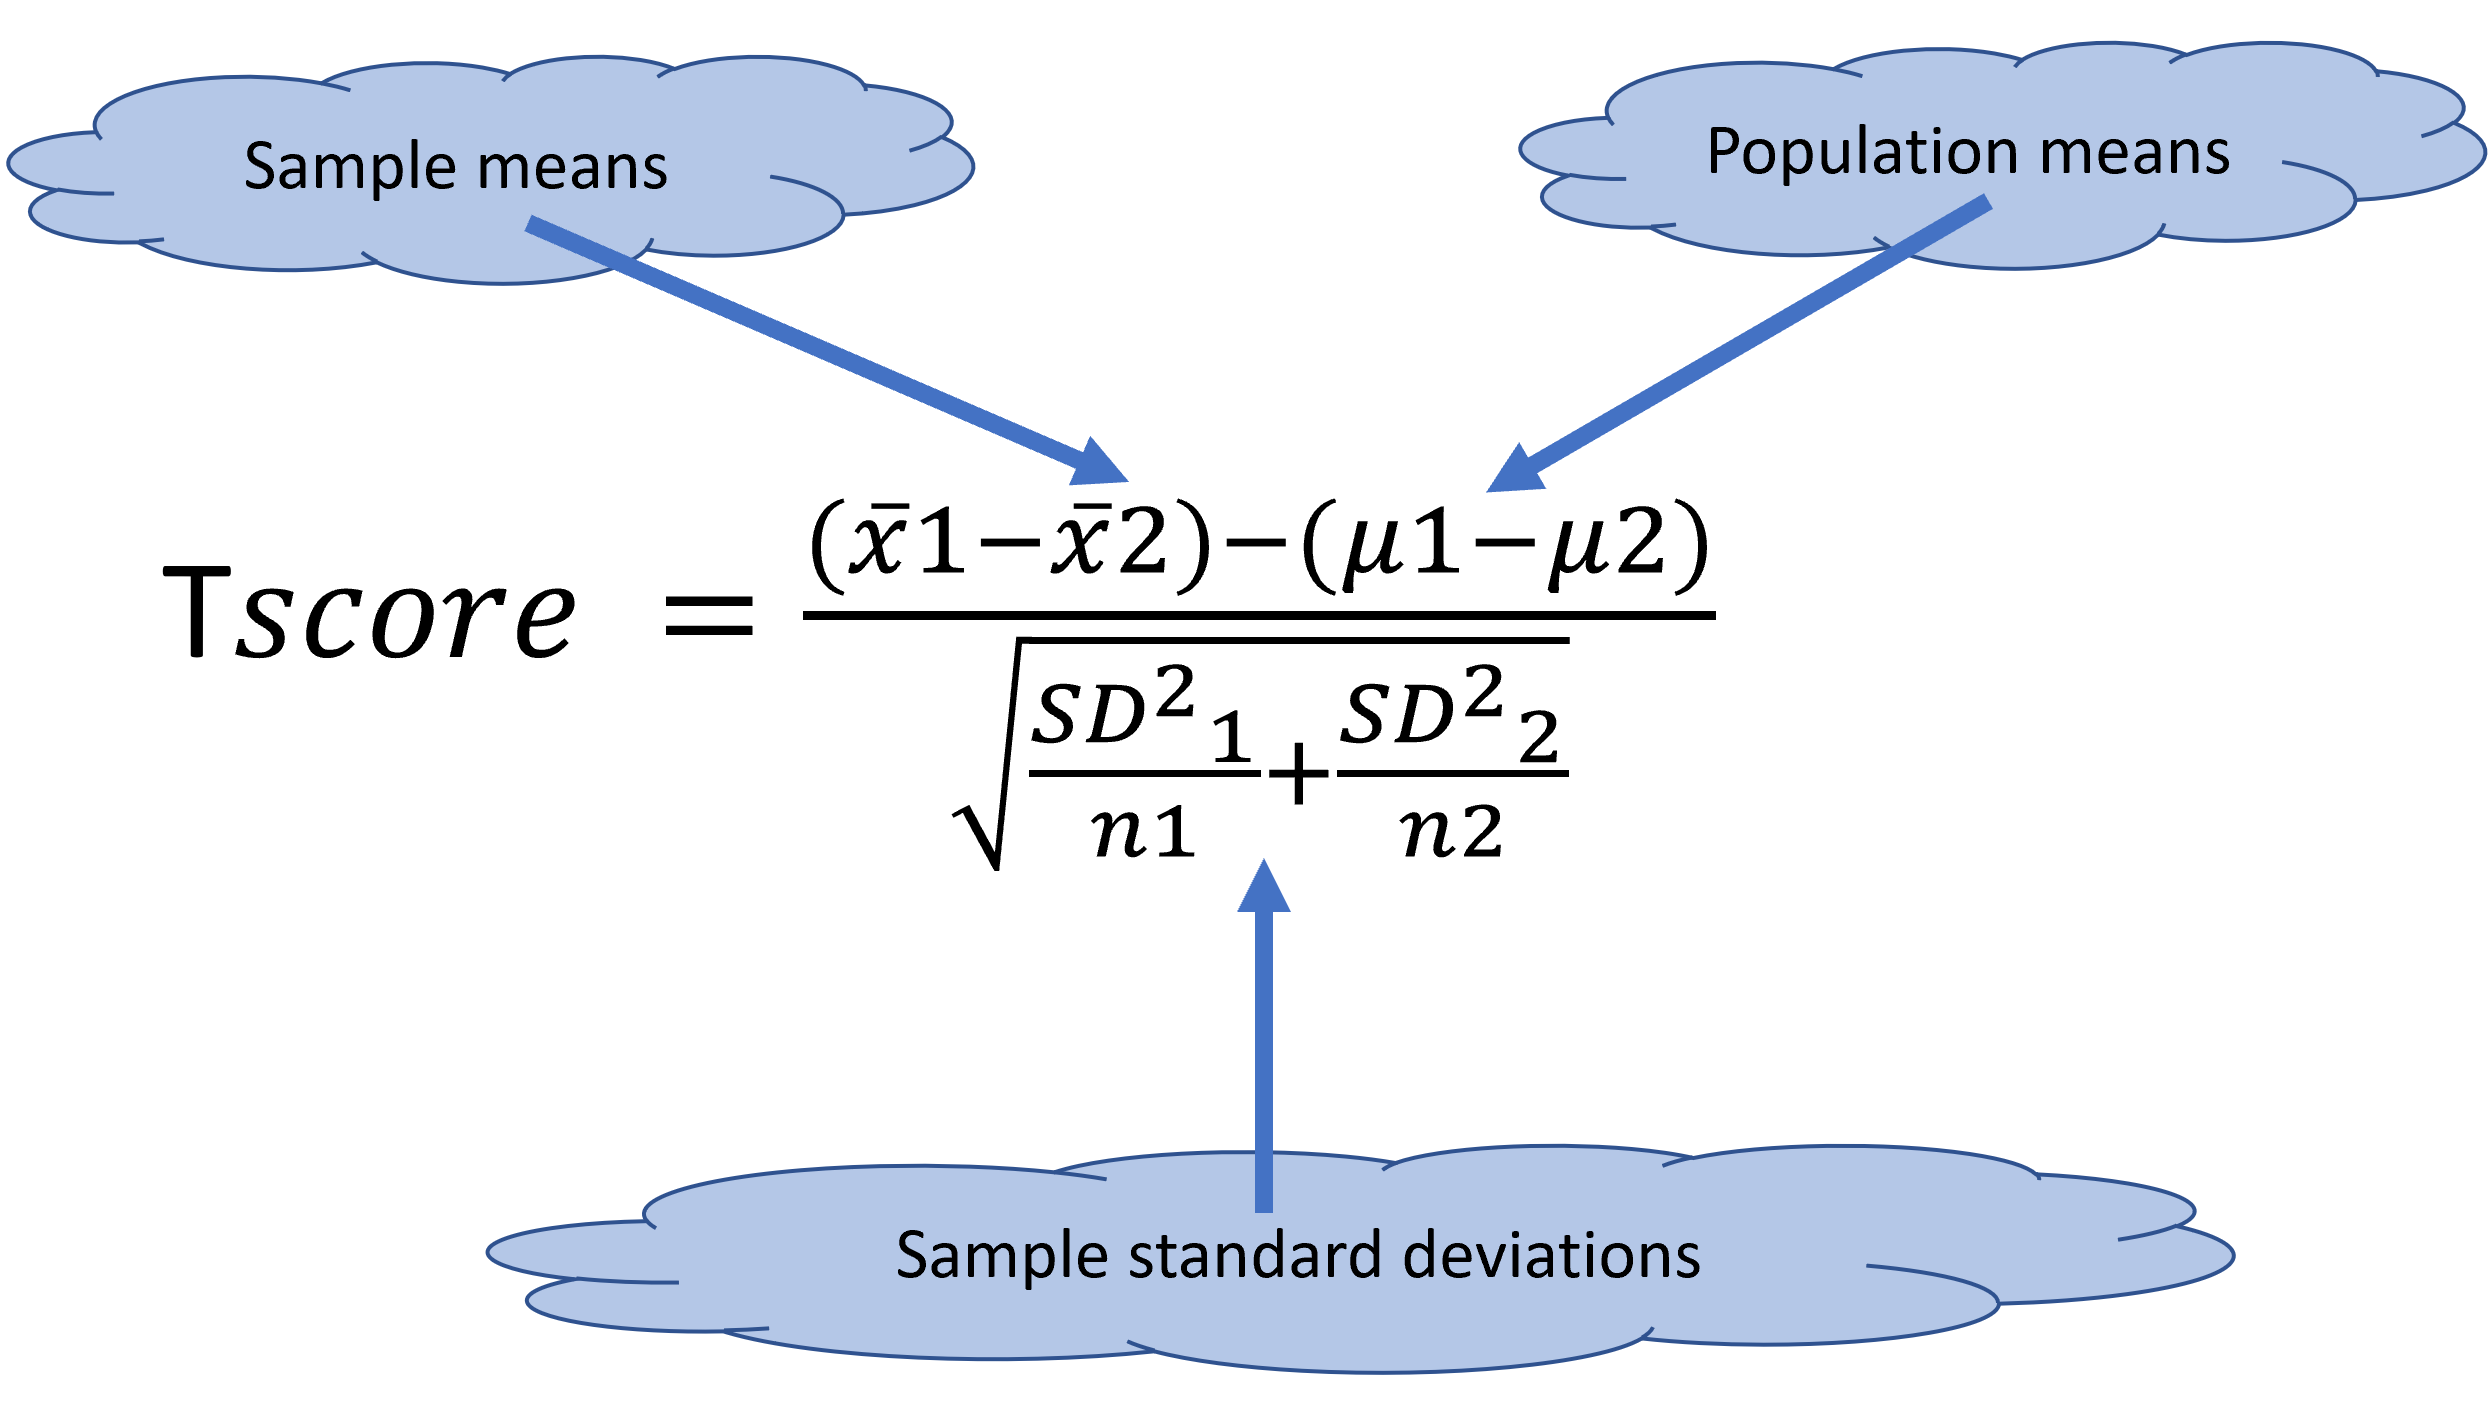
Since the null hypothesis usually states
\( \mu_1-\mu_2=0 \),
the formula simplifies to
\( t=\dfrac{\bar{x}_1-\bar{x}_2}{\sqrt{\dfrac{s_1^2}{n_1}+\dfrac{s_2^2}{n_2}}} \)
Where:
- \( \bar{x}_1,\bar{x}_2 \) = Sample means
- \( s_1,s_2 \) = Sample standard deviations
- \( n_1,n_2 \) = Sample sizes
- \( \mu_1-\mu_2 \) = Difference stated in the null hypothesis (usually 0)
Degrees of Freedom
The test statistic follows a t-distribution when the null hypothesis is true.
The degrees of freedom are calculated using technology.
The degrees of freedom always satisfy
\( \min(n_1-1,\;n_2-1)\le df\le n_1+n_2-2 \)
Graphing calculators and statistical software automatically compute the appropriate degrees of freedom.
| Component | Meaning |
|---|---|
| \( \bar{x}_1-\bar{x}_2 \) | Observed difference between the sample means |
| \( \mu_1-\mu_2 \) | Difference specified by the null hypothesis |
| \( \sqrt{\dfrac{s_1^2}{n_1}+\dfrac{s_2^2}{n_2}} \) | Estimated standard error of the difference |
| \(t\) | Number of standard errors the observed difference is from the null value |
Interpreting the Test Statistic
- A large positive \(t\)-value provides evidence that Population 1 has a larger mean than Population 2.
- A large negative \(t\)-value provides evidence that Population 1 has a smaller mean than Population 2.
- A \(t\)-value close to 0 indicates that the observed sample difference is close to the difference expected under the null hypothesis.
Important AP Exam Notes
- The test statistic measures how unusual the observed difference is if the null hypothesis is true.
- Use the simplified formula only when the null hypothesis states \( \mu_1-\mu_2=0 \).
- The test statistic follows a t-distribution.
- The degrees of freedom are determined using technology.
- A larger absolute value of \(t\) generally leads to a smaller p-value.
Example
The following summary statistics were obtained from two independent random samples.
| Population 1 | Population 2 | |
|---|---|---|
| Sample Mean | 85 | 79 |
| Sample Standard Deviation | 10 | 12 |
| Sample Size | 40 | 35 |
Calculate the test statistic for testing
\(H_0:\mu_1-\mu_2=0\)
▶️ Answer / Explanation
Step 1: Write the formula.
\( t=\dfrac{(\bar{x}_1-\bar{x}_2)-0}{\sqrt{\dfrac{s_1^2}{n_1}+\dfrac{s_2^2}{n_2}}} \)
Step 2: Substitute the values.
\( t=\dfrac{85-79}{\sqrt{\dfrac{10^2}{40}+\dfrac{12^2}{35}}} \)
\(=\dfrac{6}{\sqrt{2.50+4.11}} \)
\(=\dfrac{6}{2.57} \)
\( t\approx2.33 \)
Answer
The test statistic is
\(t\approx2.33\)
This means the observed difference between the sample means is approximately 2.33 standard errors above the difference expected under the null hypothesis.
4.10.A.2 Calculating the p-value for a Two-Sample t-Test
After calculating the test statistic, the next step in a two-sample t-test is to determine the p-value.
The p-value measures how likely it is to obtain a test statistic as extreme as the one observed, assuming that the null hypothesis is true.
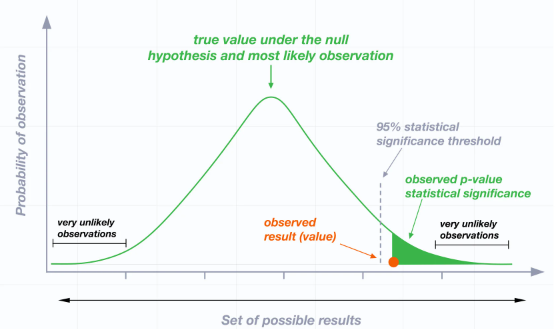
For a two-sample t-test, the p-value is found using the appropriate t-distribution.
On the AP Statistics Exam, the p-value is usually determined using a graphing calculator or other statistical technology.
Finding the p-value Using Technology
On a TI-84 Graphing Calculator:
STAT → TESTS → 2-SampTTest
Enter either:
- The raw data (Lists L1 and L2), or
- The summary statistics (\(\bar{x}_1,\;s_1,\;n_1,\;\bar{x}_2,\;s_2,\;n_2\)).
Select the appropriate alternative hypothesis:
- \( \mu_1>\mu_2 \)
- \( \mu_1<\mu_2 \)
- \( \mu_1\ne\mu_2 \)
Then select Calculate.
The calculator displays:
- The test statistic (\(t\))
- The p-value
- The degrees of freedom (\(df\))
Relationship Between the Test Statistic and the p-value
| Test Statistic | Typical p-value | Evidence Against \(H_0\) |
|---|---|---|
| Near 0 | Large | Little or no evidence |
| Moderately large | Moderate | Some evidence |
| Very large (positive or negative) | Small | Strong evidence |
Important AP Exam Notes
- The p-value is calculated assuming the null hypothesis is true.
- Use the t-distribution, not the normal distribution.
- The p-value can be found using a t-table, but the AP Exam typically expects the use of technology.
- A smaller p-value indicates stronger evidence against the null hypothesis.
- The p-value itself is not the probability that the null hypothesis is true.
Example
A researcher compares the average mathematics test scores of students from two schools.
The hypotheses are
\(H_0:\mu_1-\mu_2=0\)
\(H_a:\mu_1-\mu_2\ne0\)
Using a graphing calculator, the following results are obtained:
\(t=2.33\)
\(df\approx67\)
\(p\text{-value}=0.0228\)
Find the p-value and explain how it was obtained.
▶️ Answer / Explanation
Step 1: Enter the data into the calculator.
STAT → TESTS → 2-SampTTest
Enter either the raw data or the summary statistics.
Step 2: Choose the correct alternative hypothesis.
\(H_a:\mu_1-\mu_2\ne0\)
because this is a two-sided test.
Step 3: Read the calculator output.
The calculator reports:
Test Statistic: \(t=2.33\)
Degrees of Freedom: \(df\approx67\)
p-value = \(0.0228\)
Answer
The p-value for the two-sample t-test is
\(0.0228\)
This value was obtained using the appropriate t-distribution with technology based on the calculated test statistic and degrees of freedom.
4.10.B.1 Interpreting the p-value for a Two-Sample t-Test
After calculating the p-value, the next step is to interpret its meaning in the context of the hypothesis test.
The p-value measures how unusual the observed sample difference is if the null hypothesis is true.
It is the probability of obtaining a test statistic that is as extreme as or more extreme than the observed test statistic, in the direction specified by the alternative hypothesis, assuming that the null hypothesis is true.
For a two-sample t-test, the null hypothesis usually states that the two population means are equal.
\( H_0:\mu_1=\mu_2 \)
or equivalently
\( H_0:\mu_1-\mu_2=0 \)
Definition of the p-value
The p-value is the probability of obtaining a test statistic as extreme as or more extreme than the one observed, assuming that the null hypothesis is true.
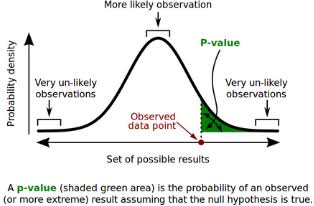
For a two-sample t-test, this means assuming that there is no true difference between the two population means.
General AP Exam Interpretation Template
Assuming that the population mean of Population 1 is equal to the population mean of Population 2, the probability of obtaining a difference between the sample means at least as extreme as the one observed (in the direction of the alternative hypothesis) is \(p\).
The interpretation must always include:
- The phrase “assuming the null hypothesis is true.”
- A reference to the two population means.
- The observed sample result (or test statistic).
- The probability (the p-value).
| p-value | Interpretation |
|---|---|
| Very Small (≤ 0.05) | The observed sample difference would be very unlikely if the population means were equal. |
| Large (> 0.05) | The observed sample difference is reasonably likely if the population means are equal. |
Important AP Exam Notes
- The p-value is always calculated assuming the null hypothesis is true.
- For a two-sample t-test, this means assuming that the two population means are equal.
- The p-value is a probability about the sample data, not about the population parameter.
- Do not say the p-value is the probability that the null hypothesis is true.
- Always interpret the p-value in the context of the problem.
Common AP Exam Mistakes
| Incorrect Statement | Why It Is Incorrect |
|---|---|
| The p-value is the probability that the null hypothesis is true. | The p-value is calculated assuming the null hypothesis is true. |
| The p-value is the probability that the population means are equal. | The p-value measures how unusual the observed sample result is if the population means are equal. |
| The p-value is the probability that the alternative hypothesis is true. | The p-value does not measure the probability that any hypothesis is true. |
Example
A researcher compares the average mathematics test scores of students from School A and School B.
The hypotheses are
\(H_0:\mu_A=\mu_B\)
\(H_a:\mu_A\ne\mu_B\)
The two-sample t-test produces a p-value of 0.0228.
Interpret the p-value.
▶️ Answer / Explanation
Assuming that the true mean mathematics test scores for School A and School B are equal, the probability of obtaining a difference between the sample mean mathematics test scores at least as extreme as the one observed (or a test statistic at least as extreme as the one observed) is 0.0228, or about 2.28%.
Because this probability is small, the observed sample difference would be unlikely if the two population means were actually equal.
4.10.C.1 Making a Decision Using the p-value and Significance Level
After calculating the p-value, the next step is to compare it with the significance level, denoted by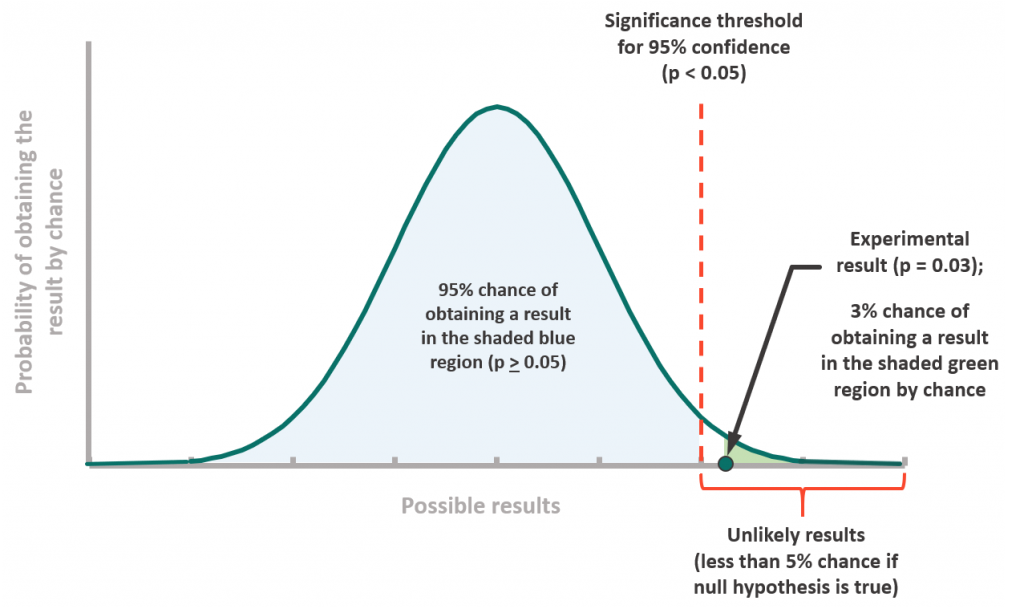
\( \alpha \)
The significance level is the cutoff value used to determine whether there is enough statistical evidence to reject the null hypothesis.
Common significance levels used in AP Statistics are
- \( \alpha=0.10 \)
- \( \alpha=0.05 \)
- \( \alpha=0.01 \)
Decision Rule
| Comparison | Decision | Interpretation |
|---|---|---|
| \(p\text{-value}<\alpha\) | Reject \(H_0\) | There is sufficient statistical evidence to support the alternative hypothesis. |
| \(p\text{-value}\ge\alpha\) | Fail to reject \(H_0\) | There is insufficient statistical evidence to support the alternative hypothesis. |
Meaning of Each Decision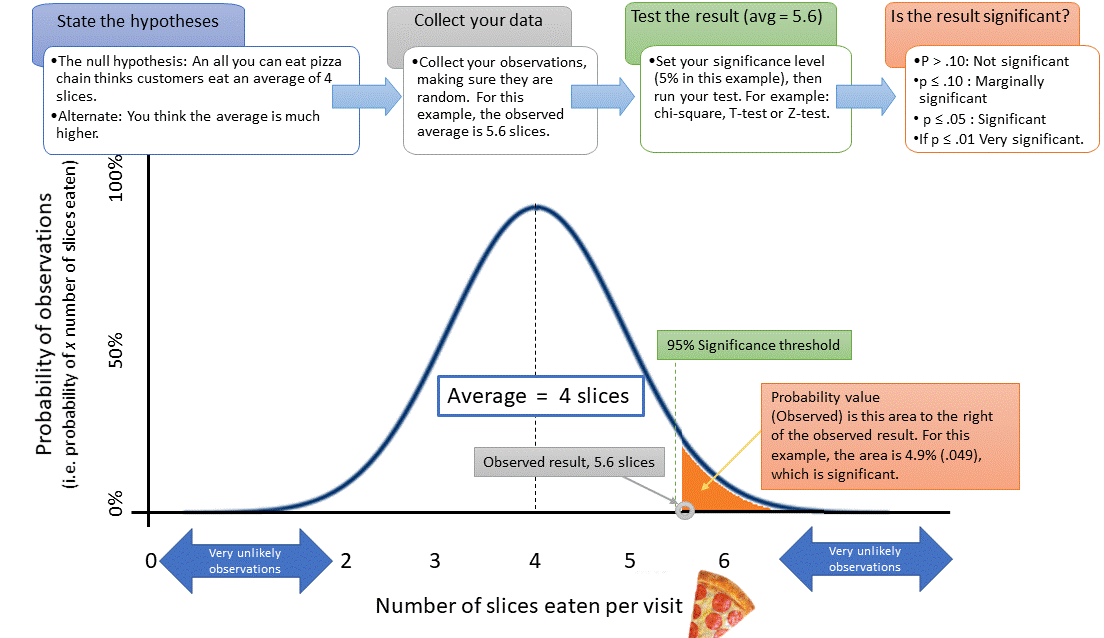
Reject the Null Hypothesis
If
\( p\text{-value}<\alpha \)
the observed sample result would be very unlikely if the null hypothesis were true.
Therefore, there is sufficient statistical evidence to reject the null hypothesis in favor of the alternative hypothesis.
Fail to Reject the Null Hypothesis
If
\( p\text{-value}\ge\alpha \)
the observed sample result is not unusual enough to reject the null hypothesis.
This does not prove that the null hypothesis is true. It simply means there is insufficient statistical evidence to support the alternative hypothesis.
| p-value | Decision at \(\alpha=0.05\) |
|---|---|
| 0.012 | Reject \(H_0\) |
| 0.041 | Reject \(H_0\) |
| 0.083 | Fail to Reject \(H_0\) |
| 0.215 | Fail to Reject \(H_0\) |
Important AP Exam Notes
- Always compare the p-value with the stated significance level \( \alpha \).
- If \(p\text{-value}<\alpha\), reject the null hypothesis.
- If \(p\text{-value}\ge\alpha\), fail to reject the null hypothesis.
- Never say “accept the null hypothesis.”
- A statistical decision should always be followed by a conclusion written in context.
Common AP Exam Mistakes
| Incorrect Statement | Correct Statement |
|---|---|
| Accept the null hypothesis. | Fail to reject the null hypothesis. |
| The null hypothesis is proven true. | There is insufficient evidence against the null hypothesis. |
| The alternative hypothesis is proven true. | There is sufficient statistical evidence to support the alternative hypothesis. |
Example
A researcher compares the average mathematics test scores of students from two schools.
The hypotheses are
\(H_0:\mu_1-\mu_2=0\)
\(H_a:\mu_1-\mu_2\ne0\)
The two-sample t-test produces
\(p\text{-value}=0.0228\)
Use a significance level of
\( \alpha=0.05 \)
State the statistical decision.
▶️ Answer / Explanation
Step 1: Compare the p-value with the significance level.
\(0.0228<0.05\)
Step 2: Apply the decision rule.
Because the p-value is less than the significance level, reject the null hypothesis.
Decision
There is sufficient statistical evidence to support the alternative hypothesis.
4.10.C.2 Using the Results of a Two-Sample t-Test to Answer an Investigative Question
The purpose of a two-sample t-test is to use sample data to answer an investigative question about the difference between two population means.
After making the statistical decision (reject or fail to reject the null hypothesis), the result should be used to answer the original research question.
The answer should always be based on statistical evidence, not personal opinion.
Connecting the Hypothesis Test to the Research Question
| Hypothesis Test Result | Answer to the Investigative Question |
|---|---|
| Reject \(H_0\) | The sample provides convincing statistical evidence to support the research claim. |
| Fail to Reject \(H_0\) | The sample does not provide convincing statistical evidence to support the research claim. |
Important AP Exam Notes
- Always answer the original investigative question.
- Use the statistical evidence from the hypothesis test to support your answer.
- Do not base the conclusion only on the sample means.
- Write the conclusion in the context of the problem.
- Do not claim that the hypothesis test proves the claim.
Example
A researcher wants to determine whether students who attend an after-school tutoring program have a higher average mathematics test score than students who do not attend tutoring.
The two-sample t-test produces
\(p\text{-value}=0.018\)
using
\(\alpha=0.05\)
Use the results of the hypothesis test to answer the investigative question.
▶️ Answer / Explanation
Since
\(0.018<0.05\),
reject the null hypothesis.
The sample provides convincing statistical evidence that students who attend the after-school tutoring program have a higher mean mathematics test score than students who do not attend tutoring.
4.10.C.3 Writing a Conclusion for a Two-Sample t-Test
After making the statistical decision, write a conclusion that is consistent with the alternative hypothesis and is stated in the context of the study.
The conclusion should:
- Be written using non-definitive language.
- Reference the population parameter.
- Reference the two populations.
- Be consistent with the statistical decision.
Conclusion
If Rejecting the Null Hypothesis
There is sufficient (or convincing) statistical evidence to conclude that the true difference between the two population means is consistent with the alternative hypothesis.
If Failing to Reject the Null Hypothesis
There is insufficient statistical evidence to conclude that the true difference between the two population means is consistent with the alternative hypothesis.
| Decision | Proper AP Conclusion |
|---|---|
| Reject \(H_0\) | There is sufficient statistical evidence to support the alternative hypothesis. |
| Fail to Reject \(H_0\) | There is insufficient statistical evidence to support the alternative hypothesis. |
Important AP Exam Notes
- Always write the conclusion in the context of the problem.
- Use population means, not sample means.
- Use phrases such as “sufficient statistical evidence” or “insufficient statistical evidence.”
- Do not say “proved” or “accepted the null hypothesis.”
- The conclusion must reference both the parameter and the populations.
Common AP Exam Mistakes
| Incorrect Statement | Correct Statement |
|---|---|
| The null hypothesis is true. | There is insufficient evidence against the null hypothesis. |
| The alternative hypothesis is proven. | There is sufficient statistical evidence to support the alternative hypothesis. |
| The sample means are different. | The population means are different (or there is evidence they differ). |
Example
A researcher compares the average mathematics test scores of students at School A and School B.
The two-sample t-test gives \(p\text{-value}=0.031\) with \(\alpha=0.05\)
Write the conclusion.
▶️ Answer / Explanation
Since
\(0.031<0.05\),
reject the null hypothesis.
There is sufficient statistical evidence to conclude that the true mean mathematics test score of students at School A differs from the true mean mathematics test score of students at School B.
This conclusion refers to the population means and is consistent with the alternative hypothesis.