AP Statistics 4.11 Parameters for a Binomial Distribution Study Notes
AP Statistics 4.11 Parameters for a Binomial Distribution Study Notes- New syllabus
AP Statistics 4.11 Parameters for a Binomial Distribution Study Notes -As per latest AP Statistics Syllabus.
LEARNING OBJECTIVE
- Probabilistic reasoning allows us to anticipate patterns in data
Key Concepts:
- Parameters for a Binomial Distribution
- Interpreting Probabilities and Parameters for a Binomial Distribution
Parameters for a Binomial Distribution
Parameters for a Binomial Distribution
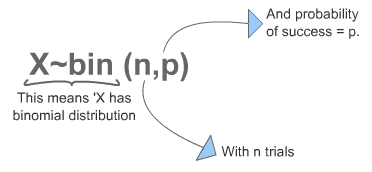
A binomial random variable \( X \) has two main parameters:
- Number of trials (\( n \)): Total number of independent experiments or trials.
- Probability of success (\( p \)): Probability of a “success” on a single trial.
Mean and Standard Deviation
- Mean (expected value): \( \mu_X = n \cdot p \)
- Variance: \( \sigma^2_X = n \cdot p \cdot (1-p) \)
- Standard deviation: \( \sigma_X = \sqrt{n \cdot p \cdot (1-p)} \)
Interpretation of Parameters
- \( n \) tells us how many independent trials we are considering.
- \( p \) tells us the chance of success in each trial.
- \( \mu_X \) gives the average number of successes we expect in \( n \) trials.
- \( \sigma_X \) measures the typical deviation from the mean — how spread out the number of successes is.
- These parameters help us understand both the center and variability of the binomial distribution.
Example
Suppose a fair coin is flipped 10 times. Let \( X \) be the number of heads.
Identify the parameters, mean, standard deviation, and interpret them.
▶️ Answer / Explanation
Step 1: Identify parameters: \( n = 10 \), \( p = 0.5 \).
Step 2: Calculate mean: \( \mu_X = n \cdot p = 10 \cdot 0.5 = 5 \).
Step 3: Calculate standard deviation: \( \sigma_X = \sqrt{n \cdot p \cdot (1-p)} = \sqrt{10 \cdot 0.5 \cdot 0.5} = \sqrt{2.5} \approx 1.58 \).
Step 4: Interpretation:
- On average, we expect 5 heads in 10 flips.
- The number of heads typically varies by about 1.58 from the mean.
- The distribution is centered at 5 heads and spread roughly between 3.4 and 6.6 heads (1 standard deviation range).
Example
A basketball player makes a free throw with a probability of success \( p = 0.8 \). She takes 15 free throws in a game. Let \( X \) be the number of successful shots.
Find the mean, standard deviation, and interpret them.
▶️ Answer / Explanation
Step 1: Identify parameters: \( n = 15 \), \( p = 0.8 \).
Step 2: Calculate mean: \( \mu_X = n \cdot p = 15 \cdot 0.8 = 12 \).
Step 3: Calculate standard deviation: \( \sigma_X = \sqrt{n \cdot p \cdot (1-p)} = \sqrt{15 \cdot 0.8 \cdot 0.2} = \sqrt{2.4} \approx 1.55 \).
Step 4: Interpretation:
- On average, she makes 12 out of 15 free throws.
- The number of successful shots typically varies by about 1.55 around the mean.
- Most of the time, the number of successful free throws is likely between 10.5 and 13.5 (1 standard deviation range).
Interpreting Probabilities and Parameters for a Binomial Distribution
Interpreting Probabilities and Parameters for a Binomial Distribution
When working with a binomial random variable, all probabilities and parameters should be described using the context of the problem and include appropriate units. This ensures meaningful conclusions.
Probability:
Express as a decimal, fraction, or percentage. Always describe what it represents in context (e.g., “the probability that a student answers exactly 3 questions correctly”).
Mean (Expected Value):
The average number of successes expected in the given number of trials. Include units (e.g., “5 heads,” “12 successful free throws”).
Standard Deviation:
Measures the typical variability in the number of successes. Include units and context (e.g., “about 1.55 successful free throws above or below the mean”).
Interpretation:
Always explain in the context of the population or situation to make results meaningful.
Example
A basketball player has a 0.8 probability of making a free throw. She takes 15 free throws in a game. Let \( X \) be the number of successful shots.
Calculate the mean and standard deviation, and interpret them with units in context.
▶️ Answer / Explanation
Step 1: Identify parameters: \( n = 15 \), \( p = 0.8 \).
Step 2: Calculate mean: \( \mu_X = n \cdot p = 15 \cdot 0.8 = 12 \).
Step 3: Calculate standard deviation: \( \sigma_X = \sqrt{n \cdot p \cdot (1-p)} = \sqrt{15 \cdot 0.8 \cdot 0.2} = \sqrt{2.4} \approx 1.55 \).
Step 4: Interpretation in context:
- The player is expected to make an average of 12 successful free throws in a game.
- The number of successful shots typically varies by about 1.55 shots above or below the mean.
- This interpretation uses the unit “successful free throws” and is meaningful in the context of her game performance.
