AP Statistics 4.2 Estimating Probabilities Using Simulation Study Notes
AP Statistics 4.2 Estimating Probabilities Using Simulation Study Notes- New syllabus
AP Statistics 4.2 Estimating Probabilities Using Simulation Study Notes -As per latest AP Statistics Syllabus.
LEARNING OBJECTIVE
- Simulation allows us to anticipate patterns in data.
Key Concepts:
- Estimating Probabilities Using Simulation
Estimating Probabilities Using Simulation
Estimating Probabilities Using Simulation
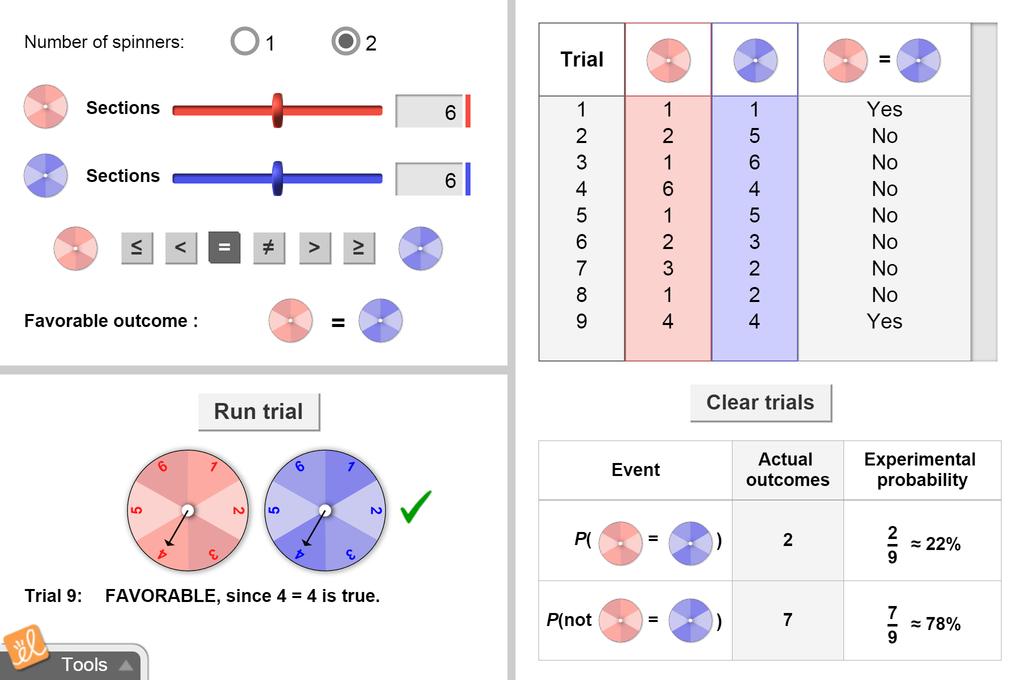
In statistics, we often face probability questions that are too complex for formulas. A simulation uses a model of a random process to estimate probabilities by mimicking real outcomes many times.
What is a Simulation?
- Simulation is a method of modeling chance behavior using random numbers or physical models.
- It imitates a real process to approximate probabilities that are hard to calculate directly.
- Relies on repeated trials — the Law of Large Numbers ensures estimates get closer to the true probability.
- Can be carried out using dice, coins, cards, random number tables, or computer software.
- Useful in real-world problems like genetics, risk analysis, or quality control.
Steps in Conducting a Simulation
- Step 1: Identify the Problem — Define the chance event and the probability question clearly.
- Step 2: State Assumptions — Decide what assumptions are made (e.g., outcomes equally likely, independence).
- Step 3: Assign Random Digits/Tools — Map real outcomes to coin flips, dice rolls, or random number generators.
- Step 4: Run Trials — Perform many repetitions to collect results.
- Step 5: Analyze Results — Estimate probability as favorable outcomes ÷ total trials.
Advantages of Simulation
- Helps with complex or real-world problems where formulas are difficult.
- Provides visual and experimental understanding of probability.
- Flexible — can model almost any scenario with random inputs.
- Improves accuracy as the number of trials increases.
- Encourages statistical thinking about variability and randomness.
Comparison Table
| Feature | Simulation | Theoretical Probability |
|---|---|---|
| Definition | Uses repeated random trials to approximate probability | Uses mathematical models to calculate exact probability |
| When Useful | Complex or real-world situations | Simple, well-defined probability models |
| Accuracy | Improves with more trials (approximate) | Exact result (if assumptions are correct) |
| Example | Rolling dice 10,000 times to estimate probability of sum = 7 | Calculating probability of sum = 7 as 6/36 = 1/6 |
Example
Estimate the probability of getting at least one head when flipping 3 coins by simulation.
▶️ Answer / Explanation
Step 1: Define event: At least one head in 3 flips.
Step 2: Assign simulation: Use random numbers (1 = H, 0 = T).
Step 3: Run 100 trials, record outcomes.
Step 4: Suppose 88 out of 100 trials had at least one head.
Conclusion: Estimated probability = 88/100 = 0.88.
Example
In a basketball game, a player makes 70% of free throws. Estimate the probability of making at least 8 out of 10 shots using simulation.
▶️ Answer / Explanation
Step 1: Define event: At least 8 successes in 10 trials, probability of success = 0.7.
Step 2: Simulation tool: Use random numbers (01–70 = success, 71–100 = miss).
Step 3: Run 1,000 simulated series of 10 shots.
Step 4: Suppose 240 of 1,000 trials had ≥ 8 successes.
Conclusion: Estimated probability = 240/1000 = 0.24.
Example
A genetics model predicts a 25% chance of offspring being type “aa.” Use simulation to estimate the proportion in 100 offspring.
▶️ Answer / Explanation
Step 1: Define event: offspring = aa (probability = 0.25).
Step 2: Simulation: Random digits 00–24 = aa, 25–99 = other types.
Step 3: Generate 100 random digits to represent 100 offspring.
Step 4: Suppose 27 offspring were aa.
Conclusion: Estimated probability ≈ 27/100 = 0.27, close to expected 0.25.
