
4.3.A.1 Understanding a Confidence Interval
A confidence interval is an interval of plausible values used to estimate an unknown population parameter, such as a population mean (\(\mu\)) or a population mean difference (\(\mu_d\)).
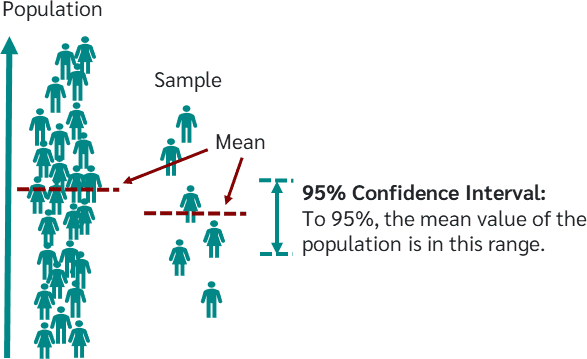
The confidence interval is calculated from sample data, not from the entire population.
Because different random samples produce different sample statistics, each random sample will generally produce a different confidence interval.
As a result, the confidence interval calculated from one sample may or may not contain the true population parameter.
This uncertainty exists because the interval is based on a sample rather than the entire population.
Key Idea
The population parameter is a fixed but unknown value, while the confidence interval is random because it depends on the sample that was selected.
| Population Parameter | Confidence Interval |
|---|---|
| Fixed but unknown. | Changes from sample to sample. |
| Only one true value exists. | Many different intervals are possible because different random samples produce different results. |
| Cannot be changed by sampling. | May or may not contain the true population parameter. |
Why Can Different Confidence Intervals Be Obtained?
- Different random samples usually have different sample means.
- Each sample produces a different standard error.
- Therefore, each sample produces a different confidence interval.
- Some intervals will contain the true population parameter, while others will not.
Important AP Exam Notes
- A confidence interval is based on sample data, so it is subject to sampling variability.
- The true population mean (or population mean difference) is fixed; it does not change from sample to sample.
- The confidence interval is the quantity that changes because different random samples produce different intervals.
- A single confidence interval either contains the population parameter or it does not. We simply do not know which is true.
- Do not say there is a certain probability that the parameter is inside a computed confidence interval. After the interval is calculated, the parameter is either inside the interval or it is not.
Example
A researcher randomly selects 40 students and constructs a 95% confidence interval for the mean number of hours students study each week.
The resulting confidence interval is
\( (7.2,\;9.1) \)
Does this interval definitely contain the true population mean?
▶️ Answer / Explanation
No.
The confidence interval was calculated using only one random sample.
Because the interval is based on sample data, it may or may not contain the true population mean.
The population mean is fixed, but the interval changes from sample to sample.
Therefore, we cannot say with certainty that the interval contains the true population mean. It either does or it does not.
4.3.A.2 Interpreting the Confidence Level
The confidence level describes how successful a confidence interval procedure is over many repeated random samples.
Suppose a confidence interval is constructed using a confidence level of \(C\%\).
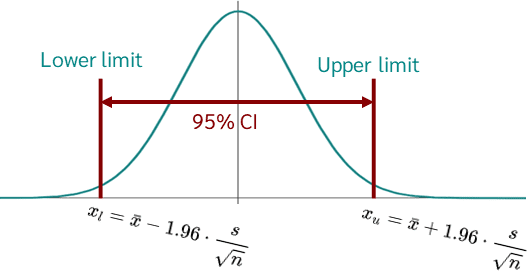
If the same sampling method is repeated many times using the same sample size from the same population, a different confidence interval will be produced each time.
Approximately \(C\%\) of those confidence intervals will contain the true population parameter, while approximately \((100-C)\%\) will not.
The confidence level describes the long-run success rate of the confidence interval procedure, not the probability that one specific interval contains the parameter.
| Confidence Level | Interpretation |
|---|---|
| 90% | Approximately 90% of confidence intervals constructed from repeated random samples will capture the true population parameter. |
| 95% | Approximately 95% of confidence intervals constructed from repeated random samples will capture the true population parameter. |
| 99% | Approximately 99% of confidence intervals constructed from repeated random samples will capture the true population parameter. |
Key Idea
The confidence level refers to the method, not to a particular confidence interval.
Once a confidence interval has been calculated, the population parameter is either inside the interval or outside the interval. There is no probability associated with that specific interval.
Important AP Exam Notes
- The confidence level describes the long-run performance of the confidence interval procedure.
- A 95% confidence level means that if the sampling process were repeated many times, approximately 95% of the resulting confidence intervals would contain the true population parameter.
- Do not say there is a 95% probability that the true population parameter is inside a computed confidence interval.
- The population parameter is fixed, while the confidence intervals vary from sample to sample.
- The confidence level applies to both a population mean (\(\mu\)) and a population mean difference (\(\mu_d\)).
Example
A researcher repeatedly selects random samples of 50 students from the same school and constructs a 95% confidence interval for the mean number of hours students study each week.
Interpret the meaning of the 95% confidence level.
▶️ Answer / Explanation
If many random samples of 50 students were repeatedly selected from the same population and a 95% confidence interval were constructed from each sample, then approximately 95% of those confidence intervals would contain the true mean number of hours students study each week.
Approximately 5% of the confidence intervals would not contain the true population mean.
This interpretation describes the long-run success rate of the confidence interval procedure, not the probability that this particular interval contains the population mean.
4.3.A.3 Interpreting a Confidence Interval in Context
After constructing a confidence interval, the final step is to interpret the interval in the context of the problem.
A confidence interval provides a range of plausible values for an unknown population parameter, such as a population mean (\(\mu\)) or a population mean difference (\(\mu_d\)).
If a \(C\%\) confidence interval is calculated as
\( (a,\;b) \)
then the correct interpretation is:
We are \(C\%\) confident that the interval \( (a,\;b) \) contains the true value of the population parameter.
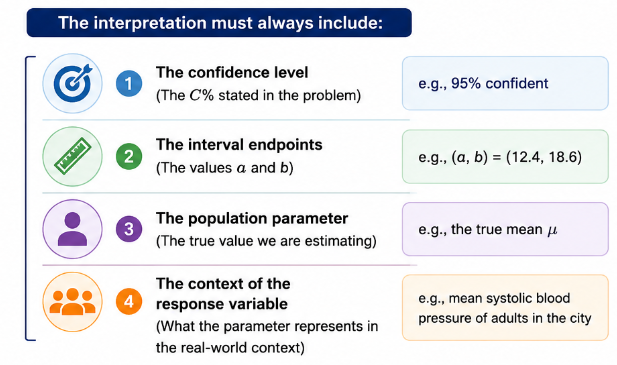
General Interpretation Template
For a Population Mean
We are \(C\%\) confident that the true population mean of [response variable] is between \(a\) and \(b\).
For a Population Mean Difference
We are \(C\%\) confident that the true population mean difference (state the order of subtraction) is between \(a\) and \(b\).
| Type of Confidence Interval | Correct Interpretation |
|---|---|
| Population Mean | We are \(C\%\) confident that the true population mean is between the lower and upper limits. |
| Population Mean Difference | We are \(C\%\) confident that the true population mean difference (with the order of subtraction clearly stated) is between the lower and upper limits. |
Common AP Exam Mistakes
- Do not say that \(C\%\) of the data lie within the confidence interval.
- Do not say there is a \(C\%\) probability that the population parameter is inside the interval.
- Always refer to the population parameter, not the sample statistic.
- Always interpret the interval using the context of the problem.
Important AP Exam Notes
- Every confidence interval interpretation should include the words “We are \(C\%\) confident…”.
- Always state the parameter being estimated.
- For matched pairs, clearly define the order of subtraction (for example, After − Before).
- The interval estimates the population parameter, not an individual observation.
Example
A 95% confidence interval for the mean number of hours that high school students sleep each night is
\( (6.8,\;7.5) \)
Interpret this confidence interval.
▶️ Answer / Explanation
We are 95% confident that the true mean number of hours that all high school students sleep each night is between 6.8 hours and 7.5 hours.
This interpretation refers to the population mean, not the sample mean or individual students.
Example (Matched Pairs)
A study compares students’ mathematics test scores before and after attending a tutoring program.
The differences are calculated as After − Before
A 90% confidence interval for the population mean difference is
\( (3.2,\;6.7) \)
Interpret this confidence interval.
▶️ Answer / Explanation
We are 90% confident that the true mean difference in mathematics test scores (After − Before) for all students who participate in the tutoring program is between 3.2 points and 6.7 points.
Because the entire interval is positive, the results suggest that the tutoring program is associated with an increase in mathematics test scores.
4.3.C Relationship Among Sample Size, Confidence Level, and Margin of Error
When constructing a confidence interval, three quantities are closely related:
- Sample size (\(n\))
- Confidence level (\(C\%\))
- Margin of error (ME)
Changing one of these quantities affects the width of the confidence interval.
4.3.C.1 Effect of Increasing the Confidence Level
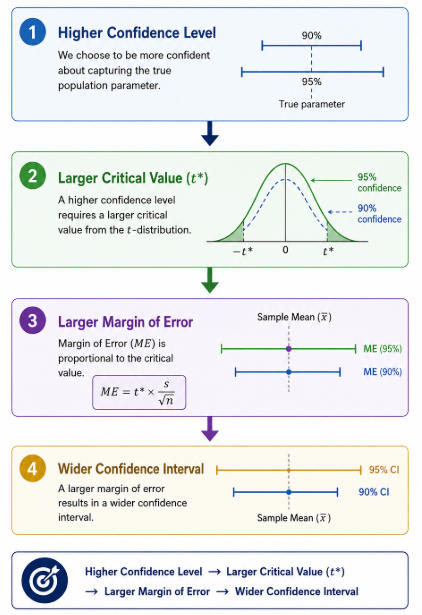
For a fixed sample size, increasing the confidence level means that we want to be more confident that the interval captures the true population parameter.
- To achieve this higher confidence, the confidence interval must become wider.
- This occurs because the critical value (\(t^*\)) increases as the confidence level increases.
Relationship
| If Confidence Level Increases | What Happens? |
|---|---|
| Critical value (\(t^*\)) | Increases |
| Margin of Error | Increases |
| Width of Confidence Interval | Increases |
4.3.C.2 Effect of Increasing the Sample Size
Increasing the sample size decreases the standard error.
Since the margin of error depends on the standard error, a smaller standard error produces a smaller margin of error.
As a result, the confidence interval becomes narrower.
Standard Error Formula
\( SE=\dfrac{s}{\sqrt{n}} \)
Because the sample size appears in the denominator, increasing \(n\) decreases the standard error.
Therefore, for a fixed confidence level, the width of a confidence interval is approximately proportional to
\( \dfrac{1}{\sqrt{n}} \)
| If Sample Size Increases | What Happens? |
|---|---|
| Standard Error | Decreases |
| Margin of Error | Decreases |
| Width of Confidence Interval | Decreases |

| Change | Critical Value | Standard Error | Margin of Error | Confidence Interval Width |
|---|---|---|---|---|
| Increase Confidence Level | ↑ | No Change | ↑ | ↑ |
| Increase Sample Size | No Significant Change* | ↓ | ↓ | ↓ |
*For large sample sizes, the critical value changes very little. On the AP Exam, the primary effect of increasing sample size is a decrease in the standard error and margin of error.
Important AP Exam Notes
- Increasing the confidence level produces a wider confidence interval.
- Increasing the sample size produces a narrower confidence interval.
- The width of a confidence interval is approximately proportional to \( \dfrac{1}{\sqrt{n}} \).
- Doubling the sample size does not cut the margin of error in half because the relationship involves the square root of \(n\).
- Always distinguish between the effects of changing the confidence level and changing the sample size.
Example
A researcher constructs a 95% confidence interval for a population mean using a sample of 64 observations.
Answer the following questions.
- If the confidence level is increased to 99% while keeping the sample size the same, what happens to the confidence interval?
- If the sample size is increased from 64 to 256 while keeping the confidence level at 95%, what happens to the confidence interval?
▶️ Answer / Explanation
Part (a)
Increasing the confidence level increases the critical value.
Therefore:
- The margin of error increases.
- The confidence interval becomes wider.
Part (b)
The standard error is
\( SE=\dfrac{s}{\sqrt{n}} \)
Increasing the sample size from
\(64\rightarrow256\)
changes
\(\sqrt{64}=8\)
\(\sqrt{256}=16\)
The denominator doubles, so the standard error is reduced by half.
Therefore:
- The margin of error decreases.
- The confidence interval becomes narrower.