
4.4.A.1 One-Sample t-Test for a Population Mean
A one-sample t-test is used to determine whether there is sufficient statistical evidence to support a claim about a population mean (\(\mu\)) when the population standard deviation (\(\sigma\)) is unknown.
Instead of estimating the population standard deviation, the sample standard deviation (\(s\)) is used. Therefore, the test statistic follows a t-distribution.
The purpose of a one-sample t-test is to decide whether the observed sample mean provides convincing evidence that the true population mean differs from a hypothesized value.
When to Use a One-Sample t-Test
- The data come from one random sample.
- The response variable is quantitative.
- The population standard deviation (\(\sigma\)) is unknown.
- The goal is to test a claim about a population mean.
Parameter of Interest
\( \mu \) = the true population mean of the response variable.
Hypotheses
The null hypothesis always contains an equality.
Null Hypothesis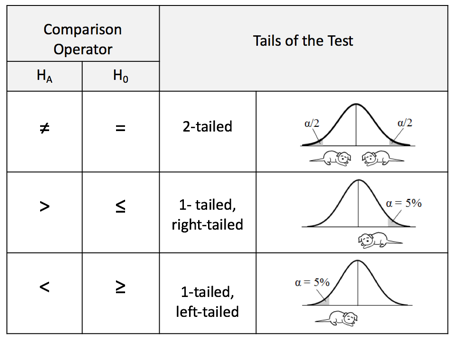
\( H_0:\mu=\mu_0 \)
Alternative Hypothesis
- \( H_a:\mu\ne\mu_0 \) (two-sided test)
- \( H_a:\mu>\mu_0 \) (right-tailed test)
- \( H_a:\mu<\mu_0 \) (left-tailed test)
where
- \( \mu_0 \) = hypothesized population mean
| Characteristic | One-Sample t-Test |
|---|---|
| Data Type | Quantitative |
| Number of Samples | One random sample |
| Parameter | Population mean (\(\mu\)) |
| Population Standard Deviation | Unknown |
| Distribution Used | t-distribution |
How to Identify This Procedure on the AP Exam
- The problem involves one sample of quantitative data.
- The question asks whether the population mean is equal to, greater than, or less than a claimed value.
- The population standard deviation is unknown.
- The appropriate procedure is a one-sample t-test for a population mean.
Important AP Exam Notes
- Use a one-sample t-test only when the population standard deviation is unknown.
- The parameter being tested is always the population mean (\(\mu\)).
- The null hypothesis always contains the equal sign (=).
- The alternative hypothesis is determined by the wording of the claim.
- Always identify both the testing procedure and the parameter in context.
Example
A nutritionist claims that the average daily sugar intake of high school students is 60 grams.
A random sample of 35 students is selected to determine whether the true mean daily sugar intake differs from 60 grams.
The population standard deviation is unknown.
Identify the appropriate hypothesis test and state the parameter of interest.
▶️ Answer / Explanation
Procedure:
The data consist of one random sample of a quantitative variable, and the population standard deviation is unknown.
Therefore, the appropriate procedure is a
One-sample t-test for a population mean.
Parameter:
\( \mu \) = the true mean daily sugar intake of all high school students.
Hypotheses:
\( H_0:\mu=60 \)
\( H_a:\mu\ne60 \)
4.4.A.2 One-Sample t-Test for a Population Mean Difference (Matched Pairs)
Sometimes a study compares two related measurements taken from the same individual or from matched individuals.
This type of study is called a matched pairs design because each observation in one sample is naturally paired with an observation in the other sample.
Examples include:
- Before-and-after measurements
- Pre-test and post-test scores
- Measurements taken on the same subject under two different conditions
Since the observations are dependent, the two samples are not analyzed separately.
Instead, the difference between each pair of observations is calculated, producing one sample of differences.
A one-sample t-test is then performed on these differences.
When to Use a Matched Pairs t-Test
- The data consist of matched pairs or repeated measurements.
- The observations are dependent.
- The response variable is quantitative.
- The differences between each pair are calculated.
- The population standard deviation of the differences is unknown.
Parameter of Interest
\( \mu_d \) = the true population mean difference.
Before writing the hypotheses, the order of subtraction must be clearly defined.
For example,
Difference = After − Before
or
Difference = Treatment − Control
The same order must be used throughout the entire hypothesis test.
Hypotheses
Null Hypothesis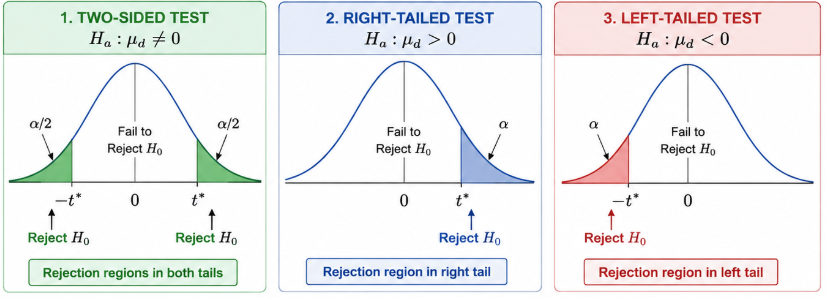
\( H_0:\mu_d=0 \)
The null hypothesis states that there is no average difference.
Alternative Hypothesis
- \( H_a:\mu_d\ne0 \) (two-sided test)
- \( H_a:\mu_d>0 \) (right-tailed test)
- \( H_a:\mu_d<0 \) (left-tailed test)
| Characteristic | Matched Pairs t-Test |
|---|---|
| Study Design | Matched pairs (dependent observations) |
| Data Analyzed | Differences between each pair |
| Parameter | \( \mu_d \) |
| Population Standard Deviation | Unknown |
| Distribution Used | t-distribution |
How to Identify This Procedure on the AP Exam
- Look for phrases such as “before and after,” “pre-test and post-test,” “same individuals,” or “matched pairs.”
- The observations are dependent because each subject provides two related measurements.
- Calculate the differences first and treat them as one sample.
- The correct procedure is a one-sample t-test for a population mean difference.
Important AP Exam Notes
- Never perform a two-sample t-test for matched pairs data.
- Always calculate the differences first.
- The parameter is the population mean difference (\(\mu_d\)).
- Clearly define the order of subtraction before writing the hypotheses.
- The null hypothesis usually states
\( H_0:\mu_d=0 \)
because a mean difference of zero indicates no treatment effect.
Example
A researcher wants to determine whether a new tutoring program improves mathematics test scores.
Twenty students take a mathematics test before the tutoring program and again after completing the program.
The population standard deviation is unknown.
Identify the appropriate hypothesis test and state the parameter of interest.
▶️ Answer / Explanation
Step 1: Identify the study design.
The same students are measured twice, so the data are matched pairs.
Step 2: Define the differences.
Difference = After − Before
Step 3: Identify the procedure.
Calculate the differences for each student and perform a
One-sample t-test for a population mean difference.
Parameter:
\( \mu_d \) = the true mean difference in mathematics test scores (After − Before) for all students who participate in the tutoring program.
Hypotheses:
\( H_0:\mu_d=0 \)
\( H_a:\mu_d>0 \)
Because the claim is that the tutoring program improves scores, the alternative hypothesis states that the mean difference (After − Before) is greater than zero.
4.4.A.3 Identifying the Parameter for a One-Sample t-Test
Before conducting a hypothesis test, it is important to clearly identify the parameter of interest.
A parameter is a numerical characteristic of a population, not a sample.
In a hypothesis test, the parameter must always refer to:
- The population being studied.
- The response variable.
- The population parameter being tested.
The appropriate parameter depends on whether the study involves a single sample or a matched pairs design.
Parameter for a One-Sample t-Test
When testing a claim about a single population mean, the parameter is
\( \mu \)
where
\( \mu \) = the true population mean of the response variable.
Example Parameter Statement
\( \mu \) = the true mean number of hours that all high school students sleep each night.
Parameter for a Matched Pairs t-Test
For a matched pairs design, the parameter is the population mean difference.
This parameter is written as
\( \mu_d \)
where
\( \mu_d \) = the true population mean difference.
Before writing the parameter, the order of subtraction must be clearly defined.
For example,
Difference = After − Before
or
Difference = Treatment − Control
The parameter should then be written in context.
Example Parameter Statement
\( \mu_d \) = the true mean difference in mathematics test scores (After − Before) for all students who participate in the tutoring program.
| Study Design | Parameter | Parameter in Context |
|---|---|---|
| One Sample | \( \mu \) | The true population mean of the response variable. |
| Matched Pairs | \( \mu_d \) | The true population mean difference, with the order of subtraction clearly stated. |
How to Write the Parameter on the AP Exam
- Identify the population.
- Identify the response variable.
- State the appropriate parameter (\(\mu\) or \(\mu_d\)).
- For matched pairs, always specify the order of subtraction.
Important AP Exam Notes
- The parameter always refers to the population, never the sample.
- Always describe the parameter in context.
- For matched pairs, clearly define the order of subtraction before writing the parameter.
- Failure to state the parameter correctly may result in the loss of communication points on the AP Statistics Exam.
Example
A researcher wants to determine whether a new tutoring program increases mathematics test scores.
The same students take a mathematics test before and after participating in the tutoring program.
Identify the parameter for the hypothesis test.
▶️ Answer / Explanation
Step 1: Identify the study design.
The same students are measured twice, so this is a matched pairs design.
Step 2: Define the differences.
Difference = After − Before
Step 3: State the parameter.
\( \mu_d \) = the true mean difference in mathematics test scores (After − Before) for all students who participate in the tutoring program.
This parameter refers to the population mean difference, not the sample mean difference.
4.4.B.1 Identifying the Null and Alternative Hypotheses
In a one-sample t-test, the first step is to state the null hypothesis and the alternative hypothesis.
These hypotheses describe competing claims about the population mean (\(\mu\)) or the population mean difference (\(\mu_d\)).
The null hypothesis represents the status quo or the claim of no change or no difference.
The alternative hypothesis represents the claim for which the researcher is seeking evidence.
One-Sample t-Test for a Population Mean
The null hypothesis is
\( H_0:\mu=\mu_0 \)
where
- \( \mu \) = True population mean
- \( \mu_0 \) = Hypothesized population mean
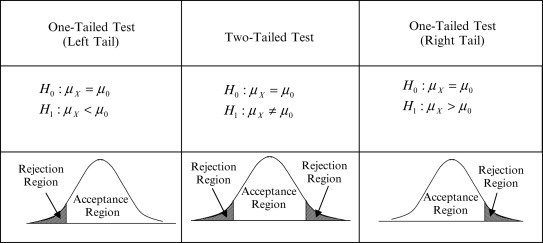
The alternative hypothesis depends on the research question.
| Type of Test | Alternative Hypothesis | When Used |
|---|---|---|
| Left-Tailed Test | \( H_a:\mu<\mu_0 \) | Claim states the population mean is less than the hypothesized value. |
| Right-Tailed Test | \( H_a:\mu>\mu_0 \) | Claim states the population mean is greater than the hypothesized value. |
| Two-Tailed Test | \( H_a:\mu\ne\mu_0 \) | Claim states the population mean is different from the hypothesized value. |
One-Sample t-Test for a Population Mean Difference (Matched Pairs)
For a matched pairs design, the hypotheses are written about the population mean difference.
First, define the order of subtraction, such as
Difference = After − Before
The null hypothesis is
\( H_0:\mu_d=0 \)
where
- \( \mu_d \) = True population mean difference
The alternative hypothesis depends on the claim.
| Type of Test | Alternative Hypothesis | Meaning |
|---|---|---|
| Left-Tailed Test | \( H_a:\mu_d<0 \) | The mean difference is less than zero. |
| Right-Tailed Test | \( H_a:\mu_d>0 \) | The mean difference is greater than zero. |
| Two-Tailed Test | \( H_a:\mu_d\ne0 \) | The mean difference is not equal to zero. |
How to Choose the Alternative Hypothesis
- Use \( < \) if the claim says less than.
- Use \( > \) if the claim says greater than.
- Use \( \ne \) if the claim says different from, changes, or is not equal to.
Important AP Exam Notes
- The null hypothesis always contains an equal sign (\(=\)).
- The alternative hypothesis never contains an equal sign.
- The hypotheses must always be written using the population parameter (\(\mu\) or \(\mu_d\)), never the sample statistic (\(\bar{x}\)).
- For matched pairs, always define the order of subtraction before writing the hypotheses.
- The wording of the research question determines whether the test is left-tailed, right-tailed, or two-tailed.
AP Exam Example
A company claims that the average battery life of its new smartphone is 20 hours.
A researcher believes the average battery life is less than 20 hours.
Write the null and alternative hypotheses.
▶️ Answer / Explanation
Parameter:
\( \mu \) = the true mean battery life of all smartphones of this model.
Null Hypothesis
\( H_0:\mu=20 \)
Alternative Hypothesis
\( H_a:\mu<20 \)
The claim is that the average battery life is less than 20 hours, so a left-tailed test is appropriate.
AP Exam Example (Matched Pairs)
A fitness coach wants to determine whether a training program increases the average number of push-ups participants can complete.
The differences are calculated as
After − Before
Write the hypotheses.
▶️ Answer / Explanation
Parameter:
\( \mu_d \) = the true mean difference in the number of push-ups completed (After − Before) for all participants.
Null Hypothesis
\( H_0:\mu_d=0 \)
Alternative Hypothesis
\( H_a:\mu_d>0 \)
Because the claim is that the training program increases performance, the alternative hypothesis is a right-tailed test.
4.4.C.1 Conditions for a One-Sample t-Test
Before performing a one-sample t-test for a population mean or a population mean difference, statisticians must verify that the required conditions are satisfied.
These conditions ensure that the results of the hypothesis test are valid and that the conclusions drawn from the test are reliable.
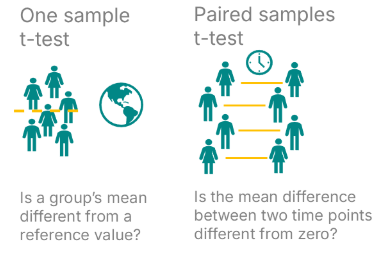
A one-sample t-test requires the following three conditions:
- Randomization Condition
- 10% Condition
- Sample Data Condition
4.4.C.1.i Randomization Condition
The data should be collected using a random sample or obtained from a randomized experiment.
Randomization reduces bias and allows the results of the hypothesis test to be generalized to the population.
How to Verify
- The problem states that a simple random sample (SRS) was selected.
- The problem states that subjects were randomly selected.
- The experiment used random assignment to treatments.
4.4.C.1.ii 10% Condition
When sampling is conducted without replacement, the sample size should be no more than 10% of the population size.
This condition allows the observations to be treated as approximately independent.
Formula
\( N \ge 10n \)
or equivalently
\( n \le 0.10N \)
Where:
- \(N\) = Population size
- \(n\) = Sample size
4.4.C.1.iii Sample Data Condition
The sampling distribution of the sample mean (or sample mean difference) should be approximately normal.
This condition is satisfied if at least one of the following is true.
| Situation | Condition Satisfied? |
|---|---|
| The population distribution is approximately normal. | ✔ Yes |
| Sample size \( n \ge 30 \). | ✔ Yes (Central Limit Theorem) |
| Sample size \( n < 30 \), but the sample data show no strong skewness and no outliers. | ✔ Yes |
| Sample size \( n < 30 \) with strong skewness or outliers. | ✘ No |
Matched Pairs Studies
For a matched pairs design, calculate the differences first and treat them as one sample.
- If the number of differences is \( n \ge 30 \), the Sample Data Condition is satisfied.
- If \( n < 30 \), the distribution of the differences should be free from strong skewness and outliers.
Summary of the Conditions
| Condition | Requirement |
|---|---|
| Randomization | Random sample or randomized experiment. |
| 10% Condition | \( N \ge 10n \) when sampling without replacement. |
| Sample Data Condition | Population is approximately normal, or \( n \ge 30 \), or if \( n < 30 \), the sample data (or differences) are free from strong skewness and outliers. |
Important AP Exam Notes
- Always verify all three conditions before performing a one-sample t-test.
- The 10% Condition applies only when sampling is done without replacement.
- For matched pairs, always check the distribution of the differences, not the original observations.
- If \( n < 30 \), examine the sample data (or differences) for strong skewness and outliers.
- On the AP Exam, you must justify each condition separately before conducting the hypothesis test.
Example
A researcher randomly selects 24 employees from a company of 1,200 employees to determine whether the average weekly overtime exceeds 5 hours.
The sample distribution is approximately symmetric with no outliers.
Determine whether it is appropriate to perform a one-sample t-test.
▶️ Answer / Explanation
Step 1: Randomization Condition
The problem states that a random sample of employees was selected.
✔ The Randomization Condition is satisfied.
Step 2: 10% Condition
Population size:
\( N=1200 \)
Sample size:
\( n=24 \)
Check the condition:
\( 10n=240 \)
Since
\( 1200 \ge 240 \),
✔ The 10% Condition is satisfied.
Step 3: Sample Data Condition
The sample size is less than 30, but the sample distribution is approximately symmetric and contains no outliers.
✔ The Sample Data Condition is satisfied.
Conclusion
Because all three conditions are satisfied, it is appropriate to perform a one-sample t-test for a population mean.