
4.7.A.1 Two-Sample t-Interval for the Difference Between Two Population Means
When comparing the means of two independent populations, it is often necessary to estimate the true difference between the population means.
A confidence interval provides a range of plausible values for this unknown difference based on information obtained from two independent random samples.
When the population standard deviations are unknown, the appropriate confidence interval procedure is a two-sample t-interval for the difference between population means.
This procedure estimates the parameter
\( \mu_1-\mu_2 \)
where
- \( \mu_1 \) = Population mean of Population 1
- \( \mu_2 \) = Population mean of Population 2
When to Use a Two-Sample t-Interval
- There are two independent random samples.
- The response variable is quantitative.
- The goal is to estimate the difference between two population means.
- The population standard deviations are unknown.
Parameter of Interest
\( \mu_1-\mu_2 \)
The parameter represents the true difference between the two population means.
The order of subtraction is important and should remain consistent throughout the problem.
For example,
Population 1 − Population 2
or
School A − School B
| Characteristic | Two-Sample t-Interval |
|---|---|
| Number of Samples | Two independent samples |
| Response Variable | Quantitative |
| Population Standard Deviations | Unknown |
| Parameter | \( \mu_1-\mu_2 \) |
| Procedure | Two-sample t-interval for the difference between population means |
How to Identify This Procedure on the AP Exam
- The problem compares two independent groups.
- The response variable is quantitative.
- The question asks you to estimate the difference between two population means.
- The population standard deviations are not known.
Important AP Exam Notes
- Use a two-sample t-interval only for independent samples.
- Do not use this procedure for matched pairs data.
- Always define the order of subtraction before interpreting the interval.
- The parameter is the difference between two population means, not the difference between sample means.
- Maintain the same order of subtraction throughout the entire solution.
Example
A researcher wants to estimate the difference in the average mathematics test scores of students from School A and School B.
Independent random samples are selected from both schools, and the population standard deviations are unknown.
Identify the appropriate confidence interval procedure and the parameter of interest.
▶️ Answer / Explanation
Step 1: Identify the study design.
The problem compares two independent samples of a quantitative variable.
Step 2: Identify the procedure.
The appropriate procedure is a
Two-sample t-interval for the difference between population means.
Step 3: State the parameter.
\( \mu_A-\mu_B \)
where
\( \mu_A \) = the true mean mathematics test score for all students at School A
and
\( \mu_B \) = the true mean mathematics test score for all students at School B.
4.7.A.2 Identifying the Parameter for a Two-Sample t-Interval
Before constructing a confidence interval, the parameter of interest must be clearly identified.
For a two-sample t-interval, the parameter is the difference between two population means.
The parameter should always include:
- The difference in the population means.
- The response variable.
- The two populations being compared.
- The order of subtraction.
Parameter
\( \mu_1-\mu_2 \)
where
- \( \mu_1 \) = True population mean for Population 1
- \( \mu_2 \) = True population mean for Population 2
Example Parameter Statement
\( \mu_A-\mu_B \) = the true difference in the mean mathematics test scores (School A − School B) for all students in the two schools.
| Component | What to Include |
|---|---|
| Population Parameter | \( \mu_1-\mu_2 \) |
| Response Variable | State what is being measured. |
| Populations | Clearly identify both populations. |
| Order of Subtraction | Keep the same order throughout the problem. |
Important AP Exam Notes
- The parameter must always refer to the population means, not the sample means.
- Always define the order of subtraction before interpreting the interval.
- The order of subtraction affects the sign of the estimated difference.
- Write the parameter completely in the context of the problem.
Example
A researcher compares the average daily screen time of students from School X and School Y.
State the parameter for a confidence interval estimating the difference between the two population means.
▶️ Answer / Explanation
Define the order of subtraction:
School X − School Y
The parameter is
\( \mu_X-\mu_Y \)
where
\( \mu_X-\mu_Y \)
represents the true difference in the mean daily screen time (School X − School Y) for all students in the two schools.
4.7.C.1 Point Estimate for the Difference Between Two Population Means
Before constructing a confidence interval, we first calculate a point estimate for the difference between two population means.
A point estimate is a single numerical value calculated from sample data that is used to estimate an unknown population parameter.
For comparing two population means, the best point estimate is the difference between the two sample means.
Point Estimate Formula
\( \bar{x}_1-\bar{x}_2 \)
Where:
- \( \bar{x}_1 \) = Sample mean from Population 1
- \( \bar{x}_2 \) = Sample mean from Population 2
The order of subtraction must remain the same throughout the entire problem.
Interpretation
The value
\( \bar{x}_1-\bar{x}_2 \)
is the best estimate of the true difference between the two population means,
\( \mu_1-\mu_2 \).
| Population Parameter | Point Estimate |
|---|---|
| \( \mu_1-\mu_2 \) | \( \bar{x}_1-\bar{x}_2 \) |
Important AP Exam Notes
- The point estimate is always the difference between the two sample means.
- The point estimate estimates the population parameter \( \mu_1-\mu_2 \).
- Always define and maintain the same order of subtraction (Population 1 − Population 2).
- A point estimate is a single value, while a confidence interval provides a range of plausible values.
Example
A researcher compares the average mathematics test scores of students from two schools.
The sample statistics are:
- School A: \( \bar{x}_1=82.4 \)
- School B: \( \bar{x}_2=77.9 \)
Find the point estimate for the difference between the population means (School A − School B).
▶️ Answer / Explanation
Step 1: Use the point estimate formula.
\( \bar{x}_1-\bar{x}_2 \)
Step 2: Substitute the sample means.
\( 82.4-77.9=4.5 \)
Answer
The point estimate for the difference between the two population means is
\( 4.5 \)
This indicates that, based on the sample data, School A’s average mathematics test score is estimated to be 4.5 points higher than School B’s.
4.7.C.2 Two-Sample t-Interval for the Difference Between Two Population Means
After calculating the point estimate, a confidence interval can be constructed to estimate the true difference between two population means.
When the population standard deviations are unknown, the appropriate procedure is a two-sample t-interval.
The confidence interval is calculated as
Point Estimate ± Margin of Error
Confidence Interval Formula
\( (\bar{x}_1-\bar{x}_2)\pm t^*\sqrt{\frac{s_1^2}{n_1}+\frac{s_2^2}{n_2}} \)
Where:
- \( \bar{x}_1,\bar{x}_2 \) = Sample means
- \( s_1,s_2 \) = Sample standard deviations
- \( n_1,n_2 \) = Sample sizes
- \( t^* \) = Critical value from the t-distribution
The critical value \(t^*\) is obtained using technology because the degrees of freedom are calculated using statistical software or a graphing calculator.
The degrees of freedom lie between
\( \min(n_1-1,\;n_2-1) \)
and
\( n_1+n_2-2 \).
| Component | Meaning |
|---|---|
| Point Estimate | \( \bar{x}_1-\bar{x}_2 \) |
| Standard Error | \( \sqrt{\frac{s_1^2}{n_1}+\frac{s_2^2}{n_2}} \) |
| Margin of Error | \( t^*\times \text{Standard Error} \) |
Important AP Exam Notes
- The confidence interval estimates the parameter \( \mu_1-\mu_2 \).
- Maintain the same order of subtraction throughout the problem.
- The critical value \(t^*\) is obtained using technology.
- The degrees of freedom are also determined using technology.
- The confidence interval is always written as Point Estimate ± Margin of Error.
Example
The following summary statistics were obtained from two independent random samples.
| Population 1 | Population 2 | |
|---|---|---|
| Sample Mean | 85 | 79 |
| Sample Standard Deviation | 10 | 12 |
| Sample Size | 40 | 35 |
Construct a 95% two-sample t-confidence interval for the difference between the population means using technology.
▶️ Answer / Explanation
Step 1: Enter the summary statistics into the calculator.
STAT → TESTS → 2-SampTInt → Stats
Step 2: Enter
- \( \bar{x}_1=85,\; s_1=10,\; n_1=40 \)
- \( \bar{x}_2=79,\; s_2=12,\; n_2=35 \)
- Confidence Level = 0.95
Step 3: Calculator Output (approximately)
95% CI: \( (0.90,\;11.10) \)
Answer
The 95% confidence interval for the difference between the two population means is
\((0.90,\;11.10)\)
We are 95% confident that the true difference in the population means (Population 1 − Population 2) is between 0.90 and 11.10.
4.7.D.1 Standard Error for the Difference Between Two Population Means
When estimating the difference between two population means, the standard error (SE) measures the typical variability of the difference between two sample means from repeated random sampling.
The standard error estimates how much the sample difference
\( \bar{x}_1-\bar{x}_2 \)
is expected to vary from the true difference between the population means.
Because the population standard deviations are usually unknown, the standard error is calculated using the sample standard deviations.
Standard Error Formula
\( SE_{\bar{x}_1-\bar{x}_2}=\sqrt{\frac{s_1^2}{n_1}+\frac{s_2^2}{n_2}} \)
Where:
- \( s_1 \) = Sample standard deviation from Population 1
- \( s_2 \) = Sample standard deviation from Population 2
- \( n_1 \) = Sample size from Population 1
- \( n_2 \) = Sample size from Population 2
The standard error is measured in the same units as the response variable.
| Component | Meaning |
|---|---|
| \( s_1,s_2 \) | Sample standard deviations |
| \( n_1,n_2 \) | Sample sizes |
| \( SE_{\bar{x}_1-\bar{x}_2} \) | Estimated standard deviation of the sampling distribution of \( \bar{x}_1-\bar{x}_2 \) |
Important AP Exam Notes
- The standard error measures the variability of the difference between sample means, not the population means.
- Always use the sample standard deviations (\(s_1\) and \(s_2\)), not the population standard deviations.
- Increasing either sample size decreases the standard error.
- A smaller standard error produces a more precise confidence interval.
Example
Two independent random samples produce the following statistics.
- \( s_1=10,\; n_1=40 \)
- \( s_2=12,\; n_2=35 \)
Calculate the standard error for the difference between the two sample means.
▶️ Answer / Explanation
Step 1: Write the formula.
\( SE_{\bar{x}_1-\bar{x}_2}=\sqrt{\frac{s_1^2}{n_1}+\frac{s_2^2}{n_2}} \)
Step 2: Substitute the values.
\(=\sqrt{\frac{10^2}{40}+\frac{12^2}{35}} \)
\(=\sqrt{\frac{100}{40}+\frac{144}{35}} \)
\(=\sqrt{2.50+4.11} \)
\(=\sqrt{6.61}\approx2.57 \)
Answer
The standard error of the difference between the two sample means is
\(2.57\)
4.7.D.2 Margin of Error for a Two-Sample t-Interval
The margin of error (ME) measures the maximum expected difference between the point estimate and the true population parameter for a given confidence level.
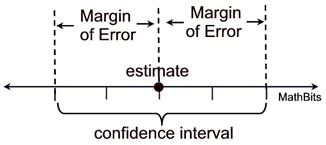
For a two-sample t-interval, the margin of error equals the critical value multiplied by the standard error.
Margin of Error Formula
\( ME=t^*\left(\sqrt{\frac{s_1^2}{n_1}+\frac{s_2^2}{n_2}}\right) \)
Where:
- \( t^* \) = Critical value from the t-distribution
- \( SE=\sqrt{\frac{s_1^2}{n_1}+\frac{s_2^2}{n_2}} \)
The confidence interval is then written as
\( (\bar{x}_1-\bar{x}_2)\pm ME \)
| Component | Formula |
|---|---|
| Standard Error | \( \sqrt{\frac{s_1^2}{n_1}+\frac{s_2^2}{n_2}} \) |
| Margin of Error | \( t^*\times SE \) |
Important AP Exam Notes
- The margin of error depends on both the critical value and the standard error.
- Higher confidence levels produce larger critical values and therefore larger margins of error.
- Larger sample sizes reduce the standard error and decrease the margin of error.
- The confidence interval is always written as Point Estimate ± Margin of Error.
Example
Using the previous example, suppose the standard error is
\( SE=2.57 \)
and the technology gives a critical value of
\( t^*=2.00 \)
Calculate the margin of error.
▶️ Answer / Explanation
Step 1: Write the formula.
\( ME=t^*\times SE \)
Step 2: Substitute the values.
\( ME=2.00(2.57) \)
\( ME=5.14 \)
Answer
The margin of error is
\(5.14\)
If the point estimate were \(6.00\), the confidence interval would be
\(6.00\pm5.14\)
or
\((0.86,\;11.14)\)