
4.8.A.1 Understanding a Confidence Interval for the Difference Between Two Population Means
When comparing two population means, the true difference between the population means is usually unknown.
A confidence interval uses information from two independent random samples to estimate this unknown difference.
Because the interval is calculated from sample data, different random samples would generally produce different confidence intervals.
As a result, the confidence interval calculated from one pair of samples may or may not contain the true difference between the two population means.
The unknown population parameter is
\( \mu_1-\mu_2 \)
where
- \( \mu_1 \) = Population mean of Population 1
- \( \mu_2 \) = Population mean of Population 2
Since only one random sample is usually collected from each population, we cannot know whether the interval actually contains the true value of
\( \mu_1-\mu_2 \).
Why Confidence Intervals Vary
Different random samples produce different sample means.
Because the sample means change from sample to sample, the calculated confidence interval also changes.
Some intervals will contain the true population difference, while others will not.
| Random Samples | Confidence Interval | Contains \( \mu_1-\mu_2 \)? |
|---|---|---|
| Sample Pair 1 | Different interval | Possibly Yes |
| Sample Pair 2 | Different interval | Possibly No |
| Sample Pair 3 | Different interval | Possibly Yes |
Key Idea
The confidence interval is a method for estimating the parameter.
Once a confidence interval has been calculated, the true difference between the population means either is inside the interval or is not inside the interval.
We simply do not know which is true because the actual population parameter is unknown.
Important AP Exam Notes
- A confidence interval is calculated using sample data, not the entire populations.
- Different random samples produce different confidence intervals.
- The interval may or may not contain the true value of \( \mu_1-\mu_2 \).
- Do not say there is a certain probability that the already calculated interval contains the parameter.
- The confidence level describes the long-run success rate of the method, not the probability that a specific interval is correct.
Example
A researcher constructs a 95% confidence interval for the difference between the average mathematics test scores of students from School A and School B.
Explain why the calculated interval may or may not contain the true difference between the two population means.
▶️ Answer / Explanation
The confidence interval is calculated using information from two random samples, not the entire populations.
If different random samples had been selected, different confidence intervals would have been obtained.
Therefore, the interval calculated from this particular pair of samples may or may not contain the true difference between the population means, \( \mu_A-\mu_B \).
Because the actual population difference is unknown, we cannot determine whether this specific interval contains the true parameter.
4.8.A.2 Interpreting the Confidence Level for the Difference Between Two Population Means
The confidence level describes how successful the confidence interval procedure is in the long run.
Because confidence intervals are calculated from random samples, different pairs of random samples will produce different confidence intervals.
If the same sampling process is repeated many times using the same sample sizes from the same two populations, some confidence intervals will contain the true difference between the population means, while others will not.
The confidence level indicates the proportion of those intervals that are expected to capture the true difference between the population means.
Interpretation of the Confidence Level
In repeated random sampling with the same sample sizes from the same two populations, approximately
\( C\% \)
of all confidence intervals constructed using the same method will contain the true difference between the two population means,
\( \mu_1-\mu_2 \).
Here,
\( C \)
represents the numerical value of the confidence level (such as 90%, 95%, or 99%).
| Confidence Level | Long-Run Interpretation |
|---|---|
| 90% | Approximately 90% of confidence intervals will capture the true difference between the population means. |
| 95% | Approximately 95% of confidence intervals will capture the true difference between the population means. |
| 99% | Approximately 99% of confidence intervals will capture the true difference between the population means. |
Important AP Exam Notes
- The confidence level describes the long-run performance of the confidence interval procedure.
- The interpretation must mention repeated random sampling.
- The interpretation must refer to the difference between the two population means.
- Do not say there is a 95% probability that the parameter is in the interval.
- The population parameter is fixed; it is the confidence intervals that vary from sample to sample.
Common AP Exam Mistakes
| Incorrect Statement | Why It Is Incorrect |
|---|---|
| There is a 95% probability that this interval contains \( \mu_1-\mu_2 \). | After the interval is calculated, it either contains the parameter or it does not. |
| 95% of the sample means are in the interval. | The confidence interval estimates a population parameter, not sample statistics. |
| 95% of the population values are inside the interval. | Confidence intervals estimate population means, not individual observations. |
Example
A researcher repeatedly selects independent random samples of 40 students from School A and 40 students from School B.
For each pair of samples, a 95% confidence interval is constructed for the difference between the population mean mathematics test scores.
Interpret the meaning of the 95% confidence level.
▶️ Answer / Explanation
If independent random samples of the same sizes are repeatedly selected from the same two populations, and a 95% confidence interval is constructed for each pair of samples, then approximately 95% of those confidence intervals will contain the true difference between the population mean mathematics test scores, \( \mu_A-\mu_B \).
This interpretation describes the long-run success rate of the confidence interval procedure.
4.8.A.3 Interpreting a Confidence Interval for the Difference Between Two Population Means
After constructing a confidence interval, the final step is to interpret the interval in the context of the problem.
A confidence interval provides a range of plausible values for the true difference between two population means.
The interpretation should always refer to:
- The confidence level.
- The difference between the two population means.
- The response variable.
- The two populations being compared.
- The order of subtraction.
General Interpretation Template
We are \(C\%\) confident that the interval
\((a,\;b)\)
contains the true difference between the two population means,
\( \mu_1-\mu_2 \),
where the difference is defined as Population 1 − Population 2.
The interpretation must be written using the context of the study.
Example Interpretation
If the confidence interval for
\( \mu_A-\mu_B \)
is
\((2.4,\;7.8)\),
then an appropriate interpretation is:
We are 95% confident that the true difference in the mean mathematics test scores (School A − School B) is between 2.4 and 7.8 points.
| Include in the Interpretation | Required? |
|---|---|
| Confidence level | ✔ Yes |
| Difference between population means | ✔ Yes |
| Response variable | ✔ Yes |
| Two populations | ✔ Yes |
| Correct order of subtraction | ✔ Yes |
Important AP Exam Notes
- Always write “We are \(C\%\) confident…”.
- The interval estimates the difference between two population means, not the difference between sample means.
- Always define and maintain the same order of subtraction throughout the problem.
- The interpretation must include the response variable and identify both populations.
- The interval gives a range of plausible values for the population difference.
Common AP Exam Mistakes
| Incorrect Statement | Correct Version |
|---|---|
| 95% of the population means are inside the interval. | The interval estimates the difference between two population means. |
| There is a 95% probability that the parameter is inside the interval. | We are 95% confident that the interval contains the true difference between the population means. |
| The average sample difference is inside the interval. | The interval estimates the true population difference. |
Example
A researcher constructs a 95% confidence interval for the difference between the average mathematics test scores of students at School A and School B.
The interval is
\((1.8,\;6.5)\)
where the difference is defined as
School A − School B.
Interpret the confidence interval.
▶️ Answer / Explanation
We are 95% confident that the true difference in the mean mathematics test scores of all students at School A and School B (School A − School B) is between 1.8 and 6.5 points.
Because the entire interval is positive, the results suggest that the population mean mathematics test score for School A is likely higher than that for School B.
4.8.B.1 Using a Confidence Interval to Justify a Claim About the Difference Between Two Population Means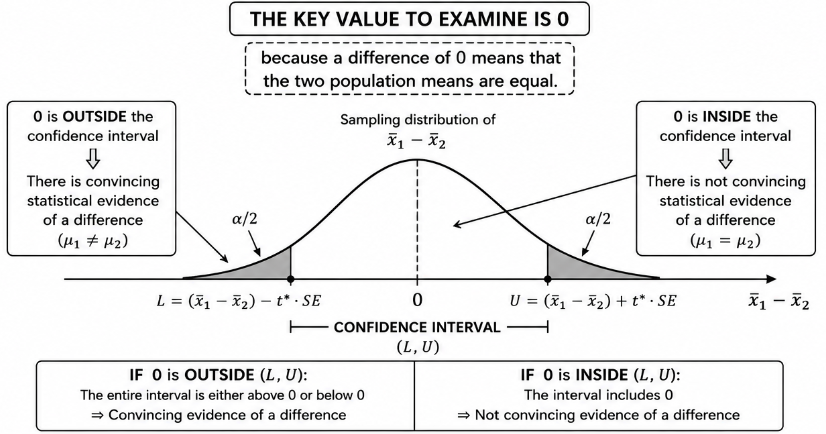
A confidence interval for the difference between two population means provides a range of plausible values for the true population difference,
\( \mu_1-\mu_2 \)
This interval can be used to determine whether there is convincing statistical evidence of a difference between the two population means.
The key value to examine is \(0\)
because a difference of 0 means that the two population means are equal.
Decision Rule
| Confidence Interval | Conclusion | Evidence |
|---|---|---|
| Contains \(0\) | Fail to conclude that the population means are different. | Insufficient evidence of a difference. |
| Does not contain \(0\) | Conclude that the population means are different. | Sufficient evidence of a difference. |
Why is 0 Important?
If
\( \mu_1-\mu_2=0 \),
then the two population means are equal, meaning there is no difference between the populations.
If 0 is included in the confidence interval, then “no difference” is a plausible value for the population difference.
If 0 is not included in the interval, then “no difference” is not a plausible value, providing convincing evidence that the two population means differ.
How to Write an AP Exam Conclusion
If the interval contains 0:
There is insufficient evidence to conclude that the two population means are different.
If the interval does not contain 0:
There is sufficient evidence to conclude that the two population means are different.
Always state the conclusion in the context of the problem.
| Confidence Interval | Interpretation |
|---|---|
| \((-3.5,\;4.2)\) | Contains 0 → No convincing evidence that the population means differ. |
| \((2.1,\;7.4)\) | Does not contain 0 → Convincing evidence that Population 1 has a larger mean than Population 2. |
| \((-8.6,\;-1.9)\) | Does not contain 0 → Convincing evidence that Population 1 has a smaller mean than Population 2. |
Important AP Exam Notes
- Always check whether the confidence interval contains 0.
- If the interval contains 0, conclude that there is insufficient evidence of a difference.
- If the interval does not contain 0, conclude that there is sufficient evidence of a difference.
- State the conclusion using the population means, not the sample means.
- Write the conclusion in the context of the study.
- Do not say the population means are “equal.” Instead, say there is insufficient evidence to conclude they are different.
Example
A researcher constructs a 95% confidence interval for the difference in the mean mathematics test scores between students at School A and School B (School A − School B).
The interval is
\((1.8,\;6.5)\)
Use the confidence interval to justify whether there is convincing evidence that the two population mean mathematics test scores differ.
▶️ Answer / Explanation
Step 1: Examine the confidence interval.
The interval is
\((1.8,\;6.5)\)
The interval does not contain 0.
Step 2: Apply the decision rule.
Because 0 is not contained in the confidence interval, there is sufficient evidence that the two population means are different.
Conclusion
There is convincing statistical evidence that the true mean mathematics test score for students at School A differs from the true mean mathematics test score for students at School B. Because the entire interval is positive, the results suggest that the population mean for School A is higher than that for School B.