
4.9.A.1 Two-Sample t-Test for the Difference Between Two Population Means
When comparing the means of two independent populations, researchers often want to determine whether there is convincing statistical evidence that the population means are different.
If the population standard deviations are unknown, the appropriate hypothesis test is a two-sample t-test for the difference between two population means.
This procedure compares the observed difference between the sample means to the difference expected if the null hypothesis is true.
The test uses information from two independent random samples to determine whether the observed difference is statistically significant.
When to Use a Two-Sample t-Test
- There are two independent random samples.
- The response variable is quantitative.
- The goal is to compare two population means.
- The population standard deviations are unknown.
Parameter Being Tested
\( \mu_1-\mu_2 \)
where
- \( \mu_1 \) = Population mean of Population 1
- \( \mu_2 \) = Population mean of Population 2
The order of subtraction should be defined before writing the hypotheses and must remain consistent throughout the entire problem.
Hypotheses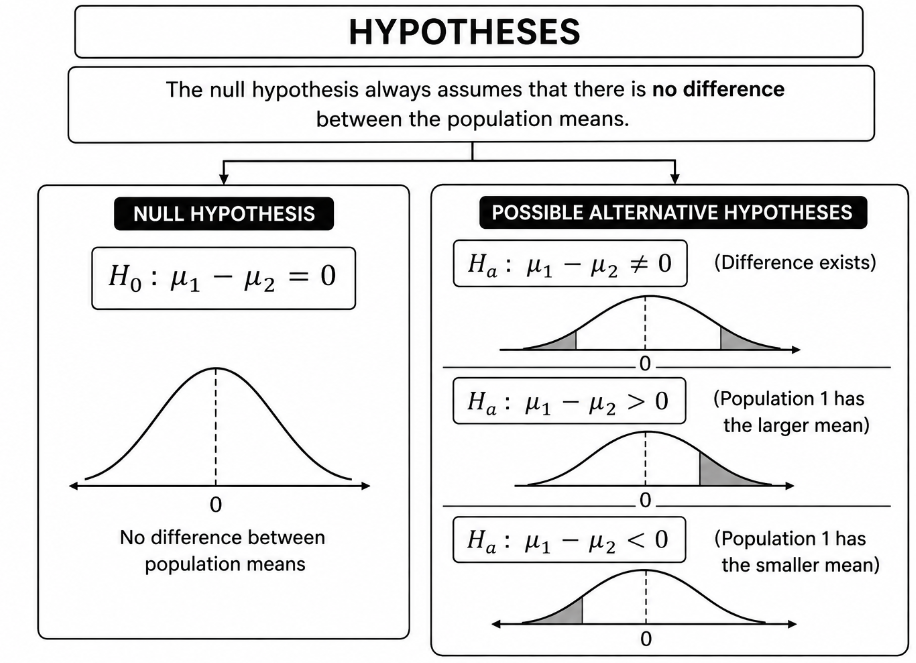
The null hypothesis always assumes that there is no difference between the population means.
Null Hypothesis
\( H_0:\mu_1-\mu_2=0 \)
Possible Alternative Hypotheses
- \( H_a:\mu_1-\mu_2\ne0 \) (Difference exists)
- \( H_a:\mu_1-\mu_2>0 \) (Population 1 has the larger mean)
- \( H_a:\mu_1-\mu_2<0 \) (Population 1 has the smaller mean)
| Situation | Appropriate Test |
|---|---|
| Two independent samples | Two-sample t-test |
| Quantitative response variable | ✔ Required |
| Unknown population standard deviations | Use the t-distribution |
Important AP Exam Notes
- Use a two-sample t-test only when comparing two independent population means.
- The response variable must be quantitative.
- The population standard deviations are assumed to be unknown.
- Always define the order of subtraction before writing the hypotheses.
- The null hypothesis always represents no difference between the population means.
Example
A researcher wants to determine whether the average mathematics test scores differ between students at School A and School B.
Independent random samples are collected from both schools, and the population standard deviations are unknown.
Identify the appropriate hypothesis test.
▶️ Answer / Explanation
The response variable (mathematics test score) is quantitative.
There are two independent random samples.
The population standard deviations are unknown.
Therefore, the appropriate procedure is a
Two-sample t-test for the difference between two population means.
4.9.A.2 Identifying the Parameter for a Two-Sample t-Test
Before performing a hypothesis test, the parameter of interest must be identified.
For a two-sample t-test, the parameter is the difference between the two population means.
The parameter statement should include:
- The population parameter.
- The response variable.
- The two populations being compared.
- The order of subtraction.
Parameter
\( \mu_1-\mu_2 \)
where
- \( \mu_1 \) = True population mean for Population 1
- \( \mu_2 \) = True population mean for Population 2
Example Parameter Statement
\( \mu_A-\mu_B \) = the true difference in the mean mathematics test scores (School A − School B) for all students at the two schools.
| Component | What to Include |
|---|---|
| Population Parameter | \( \mu_1-\mu_2 \) |
| Response Variable | Clearly identify what is being measured. |
| Populations | Clearly identify both populations. |
| Order of Subtraction | Maintain the same order throughout the test. |
Important AP Exam Notes
- The parameter always refers to the population means, never the sample means.
- Include the response variable and identify both populations.
- Always specify the order of subtraction.
- The hypotheses must match the parameter exactly.
Example
A researcher compares the average daily screen time of students from School X and School Y.
State the parameter for the hypothesis test.
▶️ Answer / Explanation
Define the order of subtraction:
School X − School Y
The parameter is
\( \mu_X-\mu_Y \)
where
\( \mu_X-\mu_Y \)
represents the true difference in the mean daily screen time (School X − School Y) for all students at the two schools.
4.9.B.1 Identifying the Null and Alternative Hypotheses for the Difference Between Two Population Means
In a two-sample t-test, the goal is to determine whether there is convincing statistical evidence that the difference between two population means is equal to a specified value, greater than a specified value, less than a specified value, or simply different from a specified value.
Before conducting the hypothesis test, both the null hypothesis and the alternative hypothesis must be stated using the population parameter.
The parameter for a two-sample t-test is
\( \mu_1-\mu_2 \)
where
- \( \mu_1 \) = Population mean of Population 1
- \( \mu_2 \) = Population mean of Population 2
The order of subtraction must be defined first and kept consistent throughout the hypothesis test.
Null Hypothesis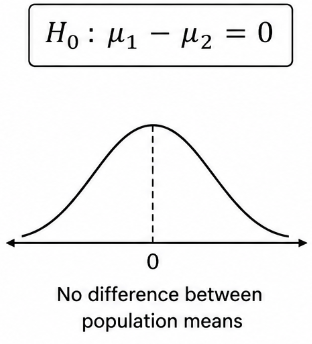
The null hypothesis always states that there is no difference between the two population means.
It can be written in either of the following equivalent forms:
\( H_0:\mu_1-\mu_2=0 \)
or
\( H_0:\mu_1=\mu_2 \)
Alternative Hypotheses
The form of the alternative hypothesis depends on the research question.
1. Left-Tailed Test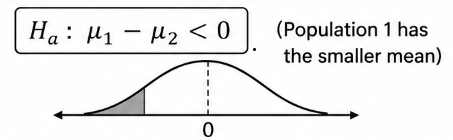
Used when the claim is that Population 1 has a smaller mean than Population 2.
\( H_a:\mu_1<\mu_2 \)
or equivalently
\( H_a:\mu_1-\mu_2<0 \)
2. Right-Tailed Test
Used when the claim is that Population 1 has a larger mean than Population 2.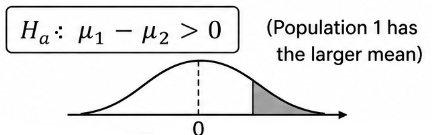
\( H_a:\mu_1>\mu_2 \)
or equivalently
\( H_a:\mu_1-\mu_2>0 \)
3. Two-Tailed Test
Used when the claim is simply that the two population means are different.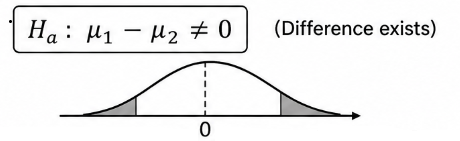
\( H_a:\mu_1\ne\mu_2 \)
or equivalently
\( H_a:\mu_1-\mu_2\ne0 \)
| Research Question | Alternative Hypothesis |
|---|---|
| Population 1 has a smaller mean. | \(H_a:\mu_1<\mu_2\) |
| Population 1 has a larger mean. | \(H_a:\mu_1>\mu_2\) |
| The population means are different. | \(H_a:\mu_1\ne\mu_2\) |
Important AP Exam Notes
- The hypotheses must always be written using the population means, never the sample means.
- The null hypothesis always represents no difference between the two population means.
- Choose the alternative hypothesis based on the wording of the research question.
- Always define and maintain the same order of subtraction throughout the problem.
- Both forms of the hypotheses (\( \mu_1-\mu_2 \) or \( \mu_1=\mu_2 \)) are mathematically equivalent and acceptable on the AP Exam.
Example
A researcher wants to determine whether students who attend an after-school tutoring program have a higher average mathematics test score than students who do not attend the program.
Let
- Population 1 = Students who attend tutoring
- Population 2 = Students who do not attend tutoring
Write the null and alternative hypotheses.
▶️ Answer / Explanation
Step 1: Define the parameter.
\( \mu_1-\mu_2 \)
where
- \( \mu_1 \) = Mean mathematics test score for students who attend tutoring.
- \( \mu_2 \) = Mean mathematics test score for students who do not attend tutoring.
Step 2: Write the hypotheses.
Null Hypothesis
\( H_0:\mu_1-\mu_2=0 \)
Alternative Hypothesis
\( H_a:\mu_1-\mu_2>0 \)
Interpretation
The alternative hypothesis states that the true mean mathematics test score for students who attend tutoring is greater than the true mean mathematics test score for students who do not attend tutoring.
4.9.C.1 Conditions for a Two-Sample t-Test for the Difference Between Two Population Means
Before performing a two-sample t-test, statisticians must verify that the required conditions are satisfied.
These conditions ensure that the hypothesis test produces reliable and valid conclusions about the difference between two population means.
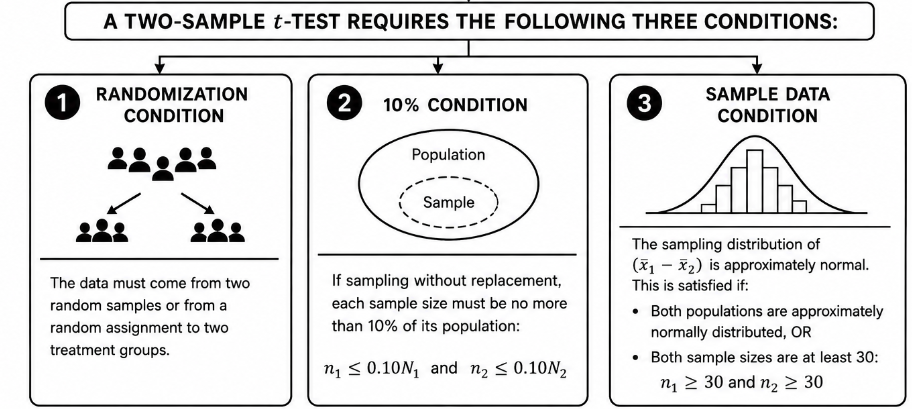
4.9.C.1.i Randomization Condition
The data should be collected using two independent random samples or from a randomized experiment.
If the study is observational, each sample should be selected randomly and independently.
If the study is an experiment, subjects should be randomly assigned to the treatment groups.
How to Verify
- Two independent simple random samples (SRS) are selected from the two populations.
- Or, subjects are randomly assigned to treatments in a randomized experiment.
4.9.C.1.ii 10% Condition
When sampling is performed without replacement, each sample size must be no more than 10% of its respective population size.
This condition ensures that observations within each sample are approximately independent.
Formulas
\( N_1 \ge 10n_1 \)
\( N_2 \ge 10n_2 \)
or equivalently
\( n_1 \le 0.10N_1 \)
\( n_2 \le 0.10N_2 \)
Where:
- \(N_1\) = Population size of Population 1
- \(N_2\) = Population size of Population 2
- \(n_1\) = Sample size from Population 1
- \(n_2\) = Sample size from Population 2
Note: If the data come from a randomized experiment, the 10% Condition is not required.
4.9.C.1.iii Sample Data Condition
The sampling distribution of the difference between the sample means should be approximately normal.
This condition is satisfied if either of the following is true:
- Both population distributions are approximately normal.
- Both sample sizes are at least 30.
If either sample size is less than 30, then both sample data distributions should be free from strong skewness and outliers.
| Condition | Requirement |
|---|---|
| Randomization Condition | Two independent random samples or a randomized experiment. |
| 10% Condition | \(N_1\ge10n_1\) and \(N_2\ge10n_2\) when sampling without replacement. |
| Sample Data Condition | Both populations are approximately normal, or both sample sizes are at least 30, or if either sample size is less than 30, both sample distributions are free from strong skewness and outliers. |
Important AP Exam Notes
- All three conditions must be verified before conducting a two-sample t-test.
- The two samples must be independent.
- The 10% Condition applies only when sampling is done without replacement.
- The 10% Condition is not required for randomized experiments because treatments are randomly assigned.
- If either sample size is less than 30, examine both sample distributions for strong skewness and outliers.
- On the AP Exam, always justify each condition separately before stating that a two-sample t-test is appropriate.
Example
A researcher wants to compare the average mathematics test scores of students from two schools.
An independent random sample of 32 students is selected from School A, which has 900 students.
An independent random sample of 36 students is selected from School B, which has 1,100 students.
The population distributions are not known to be normal.
Determine whether it is appropriate to perform a two-sample t-test.
▶️ Answer / Explanation
Step 1: Check the Randomization Condition.
The problem states that independent random samples were selected from both schools.
✔ The Randomization Condition is satisfied.
Step 2: Check the 10% Condition.
School A:
\(10n_1=10(32)=320\)
\(900\ge320\)
✔ Condition satisfied.
School B:
\(10n_2=10(36)=360\)
\(1100\ge360\)
✔ Condition satisfied.
Step 3: Check the Sample Data Condition.
The population distributions are unknown, but
\(n_1=32\ge30\)
\(n_2=36\ge30\)
Therefore, by the Central Limit Theorem, the sampling distribution of
\( \bar{x}_1-\bar{x}_2 \)
is approximately normal.
✔ The Sample Data Condition is satisfied.
Conclusion
Since all three conditions are satisfied, it is appropriate to perform a two-sample t-test for the difference between two population means.