
5.2.A.1 Correlation Coefficient (\( r \))
When two quantitative variables have a linear relationship, statisticians use the correlation coefficient, denoted by \( r \), to measure the strength and direction of that linear association.
The correlation coefficient is a single numerical value that summarizes how closely the points in a scatterplot follow a linear pattern.
Correlation Coefficient
The correlation coefficient, represented by \( r \), is a statistic that measures the strength and direction of the linear association between two quantitative variables.
Key Properties of the Correlation Coefficient
- \( r \) is unit-free. Changing the units of either variable (for example, centimeters to meters) does not change the value of \( r \).
- \( r \) has no units because it measures the strength of a relationship rather than the magnitude of the variables.
- The value of \( r \) is always between \( -1 \) and \( 1 \), inclusive.
\( -1 \le r \le 1 \)
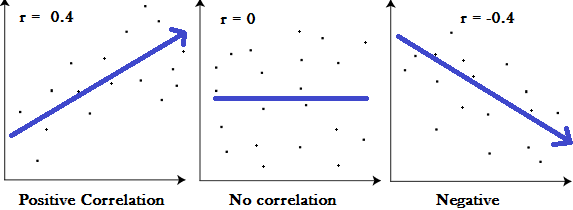
- The sign of \( r \) indicates the direction of the linear association.
| Value of \( r \) | Interpretation |
|---|---|
| \( r>0 \) | Positive linear association. As the explanatory variable increases, the response variable tends to increase. |
| \( r<0 \) | Negative linear association. As the explanatory variable increases, the response variable tends to decrease. |
| \( r=0 \) | No linear association between the variables. |
Important Notes
- The correlation coefficient describes only linear relationships.
- Correlation should always be interpreted in the context of the variables being studied.
- Changing the units of measurement or multiplying all observations by a positive constant does not change the value of \( r \).
- Because \( r \) has no units, it can be used to compare the strength of linear relationships measured using different units.
Example
A researcher studies the relationship between the number of hours students study each week and their mathematics test scores. The calculated correlation coefficient is
\( r = 0.82 \)
Interpret the value of the correlation coefficient in context.
▶️ Answer / Explanation
Since \( r = 0.82 \) is positive, the variables have a positive linear association.
This means that, in general, students who study for more hours tend to earn higher mathematics test scores.
Because the value of \( r \) is relatively close to \( 1 \), the linear association is fairly strong.
The value of \( r \) is unit-free, so its interpretation does not depend on whether study time is measured in hours, minutes, or another unit.
5.2.A.2 Interpreting the Strength of the Correlation Coefficient
The strength of a linear association depends on how close the correlation coefficient \( r \) is to \( -1 \) or \( 1 \).
- The farther the value of \( r \) is from \( 0 \) and the closer it is to \( -1 \) or \( 1 \), the stronger the linear association.
- The closer the value of \( r \) is to \( 0 \), the weaker the linear association.

Important Values of the Correlation Coefficient
\( -1 \le r \le 1 \)
- \( r = 1 \) indicates a perfect positive linear association. Every point lies exactly on an upward-sloping straight line.
- \( r = -1 \) indicates a perfect negative linear association. Every point lies exactly on a downward-sloping straight line.
- \( r = 0 \) indicates no linear association between the two quantitative variables.
The table below summarizes how the magnitude of \( r \) relates to the strength of a linear association.
| Correlation Coefficient | Strength of Linear Association |
|---|---|
| \( r = 1 \) or \( r = -1 \) | Perfect linear association. |
| \( |r| \) close to \( 1 \) | Strong linear association. |
| \( |r| \) moderately close to \( 1 \) | Moderate linear association. |
| \( |r| \) close to \( 0 \) | Weak linear association. |
| \( r = 0 \) | No linear association. |
Important AP Exam Notes
- The sign of \( r \) indicates the direction of the association.
- The absolute value, \( |r| \), indicates the strength of the linear association.
- Two correlations with the same absolute value have the same strength but opposite directions.
Examples
- \( r = 0.93 \): Strong positive linear association.
- \( r = -0.93 \): Strong negative linear association.
- \( r = 0.48 \): Moderate positive linear association.
- \( r = -0.21 \): Weak negative linear association.
- \( r = 0 \): No linear association.
Example
A researcher calculates the correlation coefficient between students’ weekly study time and mathematics test scores to be
\( r = -0.88 \)
Interpret the strength and direction of the linear association.
▶️ Answer / Explanation
The value of \( r \) is negative, so the association is negative.
Because \( |r| = 0.88 \) is close to \( 1 \), the linear association is strong.
Therefore, there is a strong negative linear association between weekly study time and mathematics test scores. As one variable increases, the other tends to decrease.
5.2.A.3 A Correlation Close to \( -1 \) or \( 1 \) Does Not Always Mean a Linear Model Is Appropriate
The correlation coefficient \( r \) measures the strength and direction of a linear association between two quantitative variables. However, a correlation coefficient that is close to \( -1 \) or \( 1 \) does not automatically mean that a linear model is appropriate for the data.
Before using a linear model, statisticians should always examine the scatterplot of the data. The scatterplot shows whether the relationship actually follows a linear pattern.
If the relationship is non-linear (curved), the value of \( r \) alone may give a misleading impression about the relationship.

Important AP Exam Notes
- The correlation coefficient summarizes only linear relationships.
- Always examine the scatterplot before interpreting or using the value of \( r \).
- If the scatterplot shows a curved pattern, a linear model may not be appropriate, even if the variables have a strong relationship.
- A numerical summary should never replace a visual examination of the data.
| Scatterplot Pattern | Is a Linear Model Appropriate? |
|---|---|
| Points follow an overall straight-line pattern. | Yes. A linear model may be appropriate. |
| Points follow a curved (non-linear) pattern. | No. A linear model is generally not appropriate. |
| The scatterplot contains strong outliers or unusual patterns. | Interpret the correlation with caution. A linear model may not accurately describe the relationship. |
Why Is the Scatterplot Important?
The scatterplot provides information that the correlation coefficient cannot show, such as:
- Whether the relationship is linear or non-linear.
- The presence of clusters, gaps, or outliers.
- Whether a linear model accurately represents the data.
AP Exam Tip:
On the AP Statistics Exam, do not conclude that a linear model is appropriate based only on the value of \( r \). Always use the scatterplot as supporting evidence.
Example
A scatterplot of two quantitative variables shows a clear curved pattern. The calculated correlation coefficient is
\( r = 0.94 \)
Should a linear model be used to describe the relationship? Justify your answer.
▶️ Answer / Explanation
No. Although \( r = 0.94 \) indicates a strong positive linear association, the scatterplot shows a non-linear (curved) pattern.
Since the relationship is not approximately linear, a linear model is not appropriate for describing the data.
The scatterplot should always be examined before deciding whether a linear model is appropriate.
5.2.A.4 Correlation Does Not Imply Causation
A correlation between two quantitative variables indicates that the variables are associated, meaning they tend to vary together in a predictable way. However, an observed association does not necessarily mean that changes in one variable cause changes in the other.
This important statistical principle is summarized by the statement:
Correlation Does Not Imply Causation
Even when the correlation coefficient is very close to \( 1 \) or \( -1 \), the relationship between the variables may not be a cause-and-effect relationship.

A strong correlation can occur for several reasons:
- One variable may actually influence the other.
- Both variables may be influenced by a lurking variable (a variable not included in the study).
- The observed relationship may be a coincidence.
Lurking Variable
A lurking variable is a variable that is not included in the analysis but affects one or both of the variables being studied. Lurking variables can create or strengthen an apparent association, making it appear that one variable causes the other when it does not.
| Situation | Conclusion |
|---|---|
| A strong positive or negative correlation is observed. | The variables are associated. |
| The study is observational. | A cause-and-effect conclusion cannot be made. |
| A lurking variable may influence both variables. | The observed association may not represent causation. |
| A well-designed randomized experiment shows a significant effect. | Evidence may support a cause-and-effect relationship. |
Examples

- Ice cream sales and drowning incidents tend to increase during the summer. The lurking variable is temperature, not ice cream sales causing drowning.
- Students who study more often earn higher exam scores. Although there may be a positive correlation, other factors such as prior knowledge, motivation, or attendance may also influence exam performance.
AP Exam Tip:
- When interpreting a correlation, describe the association, not a cause-and-effect relationship, unless the study is based on a properly designed randomized experiment.
- If the data come from an observational study, avoid statements such as “causes“, “results in“, or “leads to“. Instead, use phrases like “is associated with” or “tends to be related to“.
Example
A study found a correlation coefficient of
\( r = 0.91 \)
between the number of hours students spend using educational apps each week and their mathematics test scores.
A student concludes, “Using educational apps causes students to earn higher mathematics scores.”
Evaluate the student’s conclusion.
▶️ Answer / Explanation
The student’s conclusion is not justified.
The value \( r = 0.91 \) indicates a strong positive linear association between educational app usage and mathematics test scores.
However, correlation does not imply causation. The observed relationship may be influenced by lurking variables such as study habits, motivation, prior achievement, or parental support.
Unless the data were collected from a properly designed randomized experiment, the study provides evidence of an association, not a cause-and-effect relationship.