
5.3.A.1 Linear Regression Model
When the relationship between two quantitative variables appears to be approximately linear, statisticians can model the relationship using a linear regression model.
A linear regression model is a linear equation that describes the relationship between an explanatory variable and a response variable. The model is used to predict the value of the response variable based on a given value of the explanatory variable.
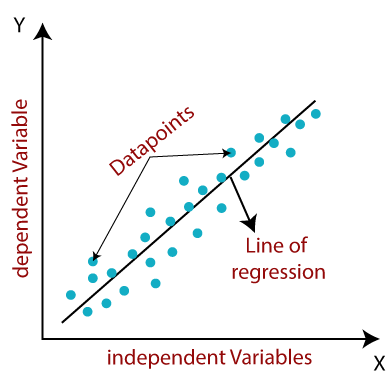
Before using a linear regression model, the scatterplot should be examined to ensure that the relationship between the variables is approximately linear.
Linear Regression Model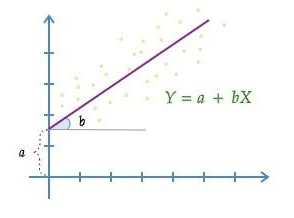
\( \hat{y}=a+bx \)
where
- \( \hat{y} \) = predicted value of the response variable
- \( a \) = y-intercept of the regression line
- \( b \) = slope of the regression line
- \( x \) = value of the explanatory variable
The regression line is often called the least-squares regression line (LSRL) because it is the line that minimizes the sum of the squared residuals.
The purpose of a linear regression model is to:
- Describe the linear relationship between two quantitative variables.
- Predict the value of the response variable for a given explanatory variable.
- Summarize the overall trend shown in a scatterplot.
| Component | Meaning |
|---|---|
| Explanatory Variable (\( x \)) | The variable used to explain or predict the response variable. |
| Response Variable (\( y \)) | The variable whose value is being predicted. |
| Regression Line | The line of best fit used to model the linear relationship between the variables. |
| Predicted Value (\( \hat{y} \)) | The estimated value of the response variable obtained from the regression model. |
Important AP Exam Notes
- A linear regression model should only be used when the scatterplot shows an approximately linear relationship.
- The regression equation provides an estimate of the response variable, not the exact value.
- Predictions made using the regression model are denoted by \( \hat{y} \), which is read as “y-hat.”
Example
A researcher collects data on the number of hours students study each week and their mathematics test scores. The scatterplot displays an approximately linear pattern.
Explain why a linear regression model is appropriate for these data.
▶️ Answer / Explanation
A linear regression model is appropriate because the scatterplot shows an approximately linear association between the explanatory variable (hours studied) and the response variable (mathematics test score).
Since the relationship is approximately linear, a regression line can be used to model the relationship and predict students’ mathematics test scores for given study times.
5.3.A.2 Calculating a Predicted Response Value Using a Linear Regression Model
Once a linear regression model has been determined, it can be used to predict the value of the response variable for a given value of the explanatory variable.
The predicted response value is represented by \( \hat{y} \) (read as “y-hat“). It is the value estimated by the regression line, not necessarily the actual observed value.
Linear Regression Equation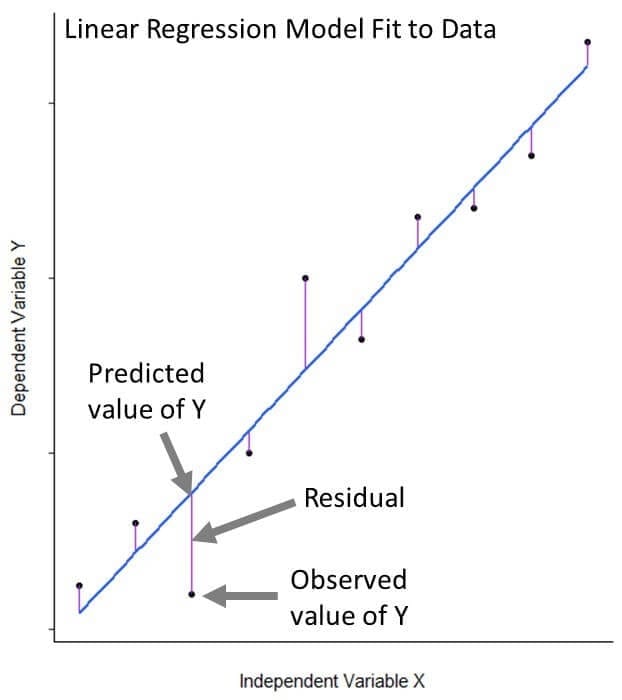
\( \hat{y}=a+bx \)
Where:
- \( \hat{y} \) = Predicted value of the response variable
- \( a \) = y-intercept of the regression line
- \( b \) = Slope of the regression line
- \( x \) = Value of the explanatory variable
Interpreting the Parameters
- y-intercept (\( a \)): The predicted value of the response variable when \( x = 0 \). The y-intercept is only meaningful if \( x = 0 \) is reasonable in the context of the data.
- Slope (\( b \)): The predicted change in the response variable for every one-unit increase in the explanatory variable.
Steps for Calculating a Predicted Response Value
- Write the linear regression equation.
- Substitute the given value of \( x \).
- Perform the arithmetic operations.
- Interpret the predicted value in the context of the problem.
| Step | Calculation |
|---|---|
| Regression Equation | \( \hat{y}=a+bx \) |
| Substitute \( x \) | Replace \( x \) with the given explanatory variable value. |
| Solve | Compute the predicted response value \( \hat{y} \). |
| Interpret | State the prediction in the context of the variables. |
Important AP Exam Notes
- The regression equation predicts the mean response for a given value of the explanatory variable.
- \( \hat{y} \) is a predicted value; it may differ from the actual observed value \( y \).
- Always interpret the predicted value in the context of the problem.
Example
The least-squares regression equation relating weekly study time (\( x \)) to mathematics test score (\( y \)) is
\( \hat{y}=55+4.5x \)
Use the regression model to predict the mathematics test score for a student who studies 8 hours per week.
▶️ Answer / Explanation
Substitute \( x=8 \) into the regression equation.
\( \hat{y}=55+4.5(8) \)
\( \hat{y}=55+36 \)
\( \hat{y}=91 \)
The predicted mathematics test score for a student who studies 8 hours per week is 91.
5.3.A.3 Extrapolation
When using a linear regression model to make predictions, it is important to determine whether the value of the explanatory variable is within or outside the range of the observed data.
Extrapolation occurs when a prediction is made using a value of the explanatory variable that is beyond the interval of x-values used to construct the regression line.
Since the regression model is based only on the observed data, predictions made outside the observed range may not accurately represent the true relationship between the variables.
Definition of Extrapolation
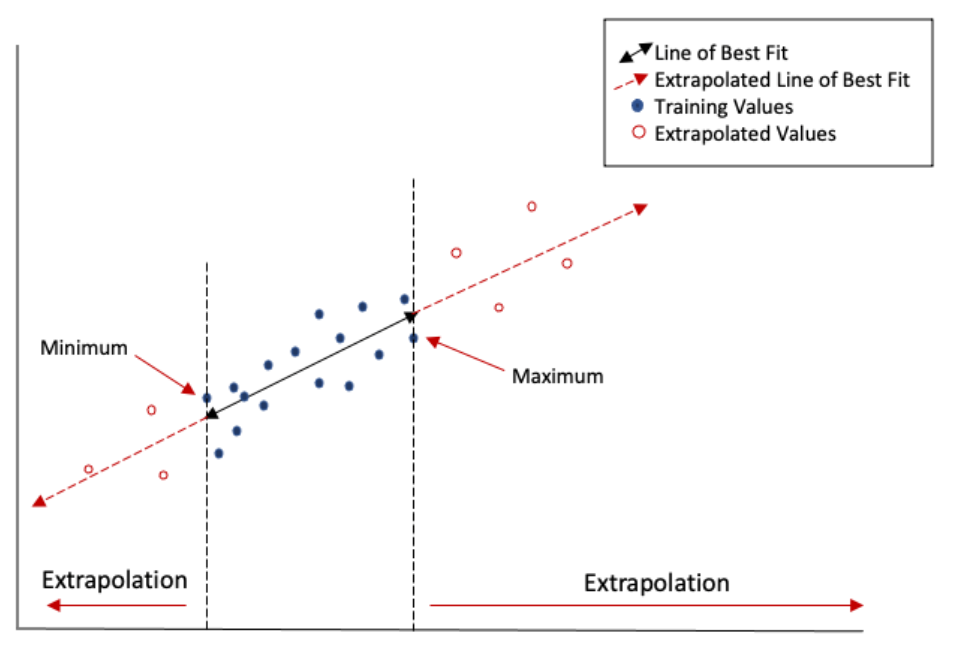
Extrapolation is predicting a response value using an explanatory variable value that lies outside the interval of observed x-values used to determine the regression line.
The farther the prediction is made beyond the observed data, the less reliable the predicted value becomes.
This is because the relationship between the variables may change outside the range of the collected data, and the linear pattern may no longer be valid.
| Observed x-values | Prediction | Type |
|---|---|---|
| 10 to 40 hours | \( x=25 \) | Not Extrapolation |
| 10 to 40 hours | \( x=55 \) | Extrapolation |
| 10 to 40 hours | \( x=5 \) | Extrapolation |
Why Is Extrapolation Risky?
- The relationship between the variables may change beyond the observed data.
- The linear trend shown by the sample may not continue indefinitely.
- The prediction becomes less reliable as the value moves farther from the observed interval.
- Extreme extrapolation can produce unrealistic or impossible predictions.
Important AP Exam Tip:
- Always compare the given value of \( x \) with the range of x-values used to create the regression model.
- If the value is outside the observed interval, state that the prediction is an extrapolation and may not be reliable.
Example
A least-squares regression line was developed using data from students who studied between 2 and 10 hours per week.
A researcher uses the regression equation to predict the exam score for a student who studies 15 hours per week.
Is this prediction an example of extrapolation? Explain.
▶️ Answer / Explanation
Yes.
The prediction uses \( x=15 \), which is outside the observed interval of 2 to 10 hours used to construct the regression line.
Therefore, the prediction is an example of extrapolation.
Because the prediction is made beyond the observed data, it is less reliable than predictions made within the original range of x-values.
5.3.A.4 Interpolation
When using a linear regression model to make predictions, the most reliable predictions are those made using values of the explanatory variable that fall within the interval of observed x-values used to construct the regression line.
Interpolation occurs when a predicted response value is calculated using a value of the explanatory variable that lies within the interval of x-values used to determine the regression line.
Since the prediction is made within the range of the observed data, the linear regression model is generally more appropriate, making the predicted value more reliable than a prediction obtained through extrapolation.
Definition of Interpolation
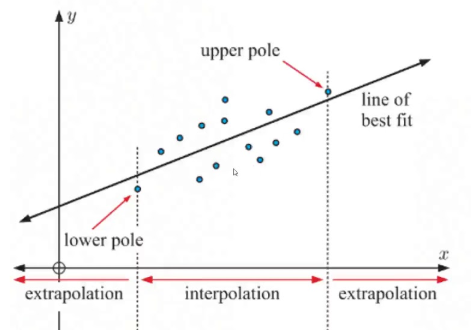
Interpolation is predicting a response value using an explanatory variable value that lies within the interval of observed x-values used to determine the regression line.
Because interpolation uses values that are already represented within the data used to construct the regression model, the predicted response is generally considered to be more reliable.
| Observed x-values | Prediction | Type |
|---|---|---|
| 10 to 40 hours | \( x=20 \) | Interpolation |
| 10 to 40 hours | \( x=35 \) | Interpolation |
| 10 to 40 hours | \( x=45 \) | Not Interpolation (Extrapolation) |
Interpolation vs. Extrapolation
| Interpolation | Extrapolation |
|---|---|
| Uses an x-value within the observed interval. | Uses an x-value outside the observed interval. |
| Generally produces more reliable predictions. | Produces less reliable predictions. |
| Supported by the observed data. | Not directly supported by the observed data. |
Important AP Exam Tip:
- Before making a prediction, compare the given value of \( x \) with the range of x-values in the original data set.
- If the value lies within the observed interval, the prediction is an interpolation and is generally more reliable.
- If the value lies outside the observed interval, the prediction is an extrapolation and should be interpreted with caution.
Example
A least-squares regression line was constructed using data collected from students who studied between 4 and 12 hours per week.
Use the regression model to predict the mathematics test score for a student who studies 8 hours per week.
Is this prediction an example of interpolation or extrapolation? Explain.
▶️ Answer / Explanation
The prediction is an example of interpolation.
The value \( x=8 \) lies within the observed interval of 4 to 12 hours used to construct the regression line.
Because the prediction is made within the range of the original data, it is generally considered to be more reliable than a prediction obtained through extrapolation.