Confidence Intervals for a Population Proportion
Confidence Interval:
A confidence interval is a range of plausible values for a population parameter, based on sample data. It has the form: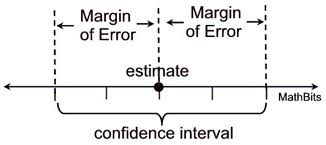
$\text{estimate ± margin of error}$
The confidence level (such as $90\%, 95\%, 99\%$) tells us how confident we are that this interval captures the true population parameter if we were to repeat the sampling process many times.
Step 1: Identify the Procedure
We use a 1-sample z-interval for a population proportion.
Formula:
$\hat{p} \pm z^* \sqrt{\dfrac{\hat{p}(1-\hat{p})}{n}}$
where:
- \(\hat{p} = \dfrac{x}{n}\) is the sample proportion
- \(z^*\) is the critical value from the standard Normal distribution (depends on confidence level)
Step 2: Verify Conditions
- Random: The data come from a random sample or randomized experiment.
- Independence: The sample observations are independent.
- If sampling without replacement, check the 10% condition: \(n \leq 0.1N\).
- Normal: The sample size is large enough for the sampling distribution of \(\hat{p}\) to be approximately Normal.
- Check: \(n\hat{p} \geq 10\) and \(n(1 – \hat{p}) \geq 10\).
Example:
A survey of 200 students finds that 124 support extending library hours. Construct and interpret a 95% confidence interval for the true proportion of students who support the change.
▶️ Answer / Explanation
Step 1: Identify procedure. This is a confidence interval for a single population proportion → use 1-sample z-interval.
Step 2: Verify conditions.
- Random: Assume the 200 students were randomly sampled.
- Independence: Population is much larger than 2000, so 10% condition is met.
- Normal: \( \hat{p} = \dfrac{124}{200} = 0.62 \). Check: \( n\hat{p} = 200(0.62) = 124 \geq 10 \), \( n(1-\hat{p}) = 200(0.38) = 76 \geq 10 \).
Step 3: Calculate interval.
\(\hat{p} = 0.62,\; SE = \sqrt{\dfrac{0.62(0.38)}{200}} \approx 0.034\)
At 95% confidence, \( z^* = 1.96 \).
CI = \( 0.62 \pm 1.96(0.034) \approx (0.55,\; 0.69) \).
Conclusion: We are 95% confident that the true proportion of students who support extending library hours is between 55% and 69%.
Example:
A researcher wants to construct a 95% confidence interval for a population proportion. Which of the following sets of conditions must be verified before using a 1-sample z-interval for a proportion?
- The population distribution is Normal, and the population standard deviation is known.
- The data come from a random sample, the population is at least 10 times the sample size, and both \(n\hat{p}\) and \(n(1-\hat{p})\) are at least 10.
- The sample is at least 30, and the data come from a Normal distribution.
- The data are collected from a census, and the sample is greater than 10% of the population.
▶️ Answer / Explanation
Step 1: For a confidence interval for a proportion, we need random sample, independence (10% condition), and Normal approximation (success-failure condition).
Step 2: Option B matches these conditions exactly.
Correct Answer: B
Margin of Error for a Population Proportion
Standard Error (SE):
The standard error describes the typical distance between the sample proportion and the true population proportion.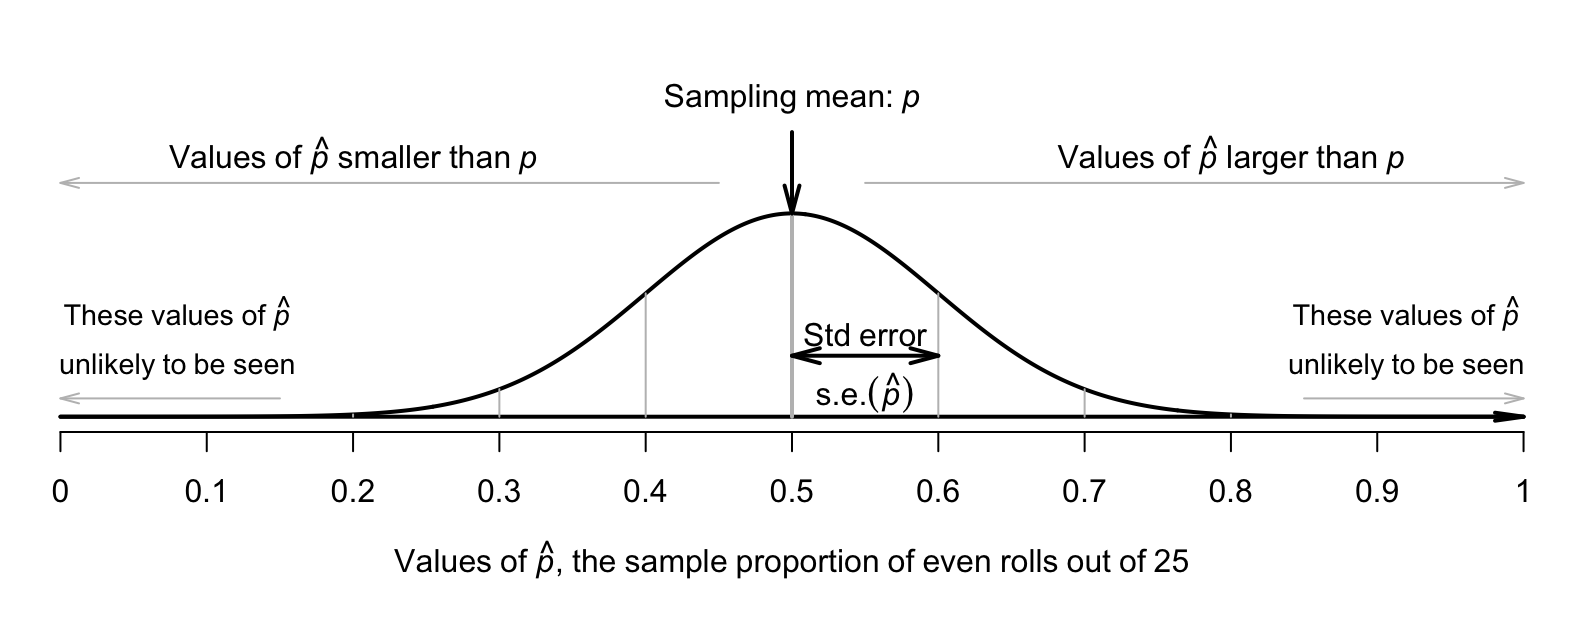
SE = \( \sqrt{\dfrac{\hat{p}(1-\hat{p})}{n}} \)
- \(\hat{p} = \dfrac{x}{n}\) is the sample proportion
- \(n\) = sample size
For Categorical Variables:
When dealing with proportions (categorical data), the margin of error is calculated by multiplying the standard error by a critical value from the Normal distribution:
ME = \( z^* \cdot SE = z^* \sqrt{\dfrac{\hat{p}(1-\hat{p})}{n}} \)
- \(z^*\) = critical value (for 95% confidence, \(z^* \approx 1.96\))
- The margin of error tells us how much we can expect our sample proportion to differ from the true population proportion.
Estimating Sample Size for a Desired Margin of Error:
To plan a study, rearrange the formula to solve for \(n\):
\( n = \dfrac{(z^*)^2 \cdot \hat{p}(1-\hat{p})}{(ME)^2} \)
- If no prior estimate of \(\hat{p}\) is available, use \(\hat{p} = 0.5\) because it produces the largest possible sample size (most conservative).
Example:
A survey of 200 students finds that 124 support extending library hours. Construct a 95% confidence interval and determine the margin of error.
▶️ Answer / Explanation
Step 1: Compute sample proportion. \(\hat{p} = \dfrac{124}{200} = 0.62\).
Step 2: Compute SE. \( SE = \sqrt{\dfrac{0.62(0.38)}{200}} \approx 0.034 \).
Step 3: Compute ME. For 95% confidence, \( z^* = 1.96 \). \( ME = 1.96(0.034) \approx 0.067 \).
Conclusion: The margin of error is about 6.7 percentage points.
Example:
A researcher wants to estimate the true proportion of voters who favor a policy to within ±4% at the 95% confidence level. What sample size is required?
▶️ Answer / Explanation
Step 1: Identify values. Desired ME = 0.04, \( z^* = 1.96 \). No prior \(\hat{p}\) → use 0.5.
Step 2: Apply formula. \( n = \dfrac{(1.96)^2(0.5)(0.5)}{(0.04)^2} \)
= \( \dfrac{3.8416 \cdot 0.25}{0.0016} = \dfrac{0.9604}{0.0016} \approx 600.25 \).
Step 3: Round up. \( n = 601 \).
Conclusion: A sample of at least 601 voters is needed.