Test Statistic and Null Distribution for a Population Proportion
A test statistic is a standardized value computed from sample data used to decide whether to reject the null hypothesis \( H_0 \). It measures how far the sample statistic (\( \hat{p} \)) is from the hypothesized population proportion (\( p_0 \)), in units of standard error.
Formula (One-Sample z-Test for a Population Proportion):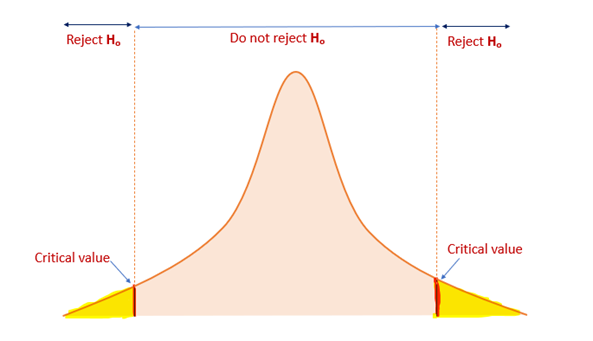
\( z = \dfrac{\hat{p} – p_0}{\sqrt{\dfrac{p_0(1 – p_0)}{n}}} \)
- \( \hat{p} = \) sample proportion
- \( p_0 = \) hypothesized population proportion under \( H_0 \)
- \( n = \) sample size
Null Distribution:
- Assumes \( H_0 \) is true.
- Two possibilities for the null distribution of the test statistic:
- Randomization distribution: Based on resampling or simulation from the observed data.
- Theoretical distribution: Assumes a probability model (here, z-distribution) for the test statistic.
- The z-test uses the standard Normal distribution as the theoretical null distribution.
P-value: The p-value is the probability of obtaining a test statistic as extreme or more extreme than the observed value, assuming the null hypothesis and the probability model are true. It quantifies the strength of evidence against \( H_0 \). The significance level \( \alpha \) may be given or chosen by the researcher and is used to decide whether the evidence is strong enough to reject \( H_0 \).
Decision Rule: Compare the P-value to significance level \( \alpha \):
- P-value ≤ \( \alpha \) → reject \( H_0 \)
- P-value > \( \alpha \) → fail to reject \( H_0 \)
Example:
A company claims 80% of customers are satisfied. A random sample of 100 customers finds 74 satisfied. Test at 5% significance whether the satisfaction rate is less than 80%.
▶️ Answer / Explanation
Step 1: Hypotheses
\( H_0 : p = 0.80 \)
\( H_a : p < 0.80 \) (left-tailed)
Step 2: Verify Conditions
- Random sample assumed ✅
- 10% condition: 100 ≤ 0.1N ✅
- Normal approximation: \( n p_0 = 80 \geq 10 \), \( n(1-p_0) = 20 \geq 10 \) ✅
Step 3: Test Statistic
\( \hat{p} = 74/100 = 0.74 \)
\( z = \dfrac{0.74 – 0.80}{\sqrt{0.8*0.2/100}} = \dfrac{-0.06}{0.04} = -1.5 \)
Step 4: P-value
Left-tailed: \( P(Z < -1.5) \approx 0.067 \)
Step 5: Decision
P-value > 0.05 → fail to reject \( H_0 \). There is insufficient evidence that the satisfaction rate is less than 80%.
Step 6: Null Distribution Concept
- Here, the test statistic z is assumed to follow the standard Normal distribution (theoretical null distribution).
- If using simulation, we could generate a randomization distribution of \( \hat{p} \) under \( H_0 \) to approximate P-value.
Interpreting the P-Value for a Significance Test of a Population Proportion
The p-value is the probability, assuming the null hypothesis is true, of obtaining a test statistic as extreme or more extreme than the observed value. It quantifies the strength of evidence against \( H_0 \).
How to Determine the P-Value: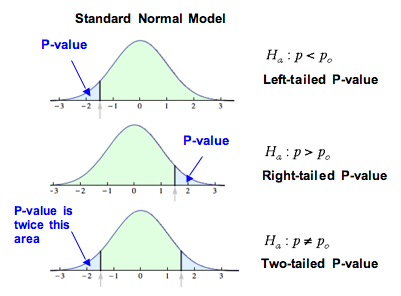
- Right-tailed test (\( H_a : p > p_0 \)) → proportion of values at or above the observed test statistic.
- Left-tailed test (\( H_a : p < p_0 \)) → proportion of values at or below the observed test statistic.
- Two-tailed test (\( H_a : p \neq p_0 \)) → sum of:
- proportion ≤ negative of the absolute value of the test statistic, and
- proportion ≥ absolute value of the test statistic.
Key Point: The p-value is calculated assuming the null hypothesis is true. That is, we assume the true population proportion is equal to the value stated in \( H_0 \) and use the probability model to determine how unusual the observed sample result is.
Interpretation in Context:
- Small p-value → observed sample result is unlikely under \( H_0 \); provides evidence against \( H_0 \).
- Large p-value → observed sample result is consistent with \( H_0 \); insufficient evidence to reject \( H_0 \).
Example:
A survey claims that 60% of voters support a law. A random sample of 150 voters finds 78 support it. Test \( H_0 : p = 0.60 \) vs \( H_a : p \neq 0.60 \). The z-test statistic is -2.00. Interpret the p-value.
▶️ Answer / Explanation
Step 1: Identify the test type
Two-tailed test (\( H_a : p \neq 0.60 \)).
Step 2: Determine the p-value
P-value = 2 × P(Z ≤ -2.00) ≈ 2 × 0.0228 = 0.0456
Step 3: Interpretation
- Assuming \( H_0 \) is true (p = 0.60), the probability of observing a sample proportion as extreme or more extreme than 0.52 is approximately 0.046.
- Since the p-value ≈ 0.046 < 0.05, the result is unlikely under \( H_0 \), providing evidence to reject \( H_0 \).
- Conclusion in context: There is evidence that the true proportion of voters supporting the law is different from 60%.