Significance Testing for a Population Proportion
Significance Level (\( \alpha \)):
- The significance level is the probability of making a Type I error : rejecting \( H_0 \) when it is actually true.
- Common choices: 0.05, 0.01, 0.10
Hypotheses:
- Null hypothesis (\( H_0 \)): specifies a value for the population proportion, usually representing no effect or a baseline claim: \( H_0: p = p_0 \)
- Alternative hypothesis (\( H_a \)) can be:
- One-sided: \( H_a: p > p_0 \) or \( H_a: p < p_0 \)
- Two-sided: \( H_a: p \neq p_0 \)
Conditions for a Valid Test:
- Independence: Random sample and 10% condition (n ≤ 0.1N if sampling without replacement)
- Normal approximation: \( n p_0 \ge 10 \) and \( n(1 – p_0) \ge 10 \)
Test Statistic:
\( z = \dfrac{\hat{p} – p_0}{\sqrt{\dfrac{p_0 (1 – p_0)}{n}}} \)
- \( \hat{p} \) = sample proportion
- \( p_0 \) = hypothesized population proportion
- \( n \) = sample size
Null Distribution:
- Assumes \( H_0 \) is true.
- Can be based on a randomization distribution (simulation) or a theoretical distribution (z-distribution).
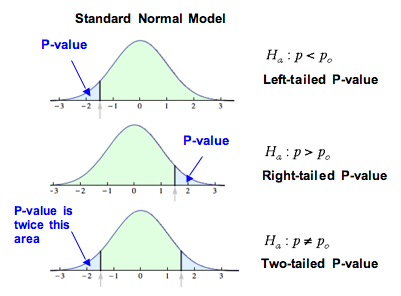
P-value:
- The probability of observing a test statistic as extreme or more extreme than the one from the sample, assuming \( H_0 \) is true.
- Right-tailed: proportion ≥ observed z; Left-tailed: proportion ≤ observed z; Two-tailed: sum of probabilities at ≤ -|z| and ≥ |z|.
- Small p-values → evidence for \( H_a \). Large p-values → insufficient evidence for \( H_a \).
Decision and Interpretation:
- Compare p-value to \( \alpha \):
- P-value ≤ \( \alpha \) → reject \( H_0 \); sufficient evidence to support \( H_a \).
- P-value > \( \alpha \) → fail to reject \( H_0 \); insufficient evidence to support \( H_a \).
- Always state conclusions in context.
- Failing to reject \( H_0 \) is NOT the same as proving \( H_0 \) is true.
Conceptual Notes:
- Rejecting \( H_0 \) → data provide sufficient statistical evidence to support \( H_a \).
- Failing to reject \( H_0 \) → data provide insufficient statistical evidence to support \( H_a \).
- Small p-values indicate the observed result is unusual under \( H_0 \), giving strong evidence for \( H_a \).
- Large p-values indicate the observed result is not unusual under \( H_0 \), providing no convincing evidence for \( H_a \) and not confirming \( H_0 \).
Example:
A company claims 80% of customers are satisfied. In a random sample of 100 customers, 74 say they are satisfied. Test at \( \alpha = 0.05 \) whether the satisfaction rate is less than 80%.
▶️ Answer / Explanation
Step 1: Hypotheses
\( H_0: p = 0.80 \)
\( H_a: p < 0.80 \) (left-tailed)
Step 2: Verify conditions
- Random sample
- 10% condition: 100 ≤ 0.1N
- Normal approximation: \( n p_0 = 80 \), \( n(1-p_0) = 20 \)
Step 3: Test Statistic
\( \hat{p} = 74/100 = 0.74 \)
\( z = \dfrac{0.74 – 0.80}{\sqrt{0.8*0.2/100}} = -1.5 \)
Step 4: P-value
Left-tailed: \( P(Z < -1.5) \approx 0.067 \)
Step 5: Decision & Conclusion
P-value 0.067 > 0.05 → fail to reject \( H_0 \)
Interpretation in context: There is insufficient statistical evidence to conclude that fewer than 80% of customers are satisfied. This does not prove the 80% claim is true; it only indicates the data are consistent with it.
Key Concept: Small p-values (< \( \alpha \)) provide evidence for \( H_a \); large p-values do not provide evidence for \( H_a \) nor prove \( H_0 \).
Example:
A coffee shop claims that at least 75% of its customers are satisfied with their service. A random sample of 80 customers finds that 54 are satisfied. Using a significance level of 0.05, which of the following is the correct conclusion?
- Reject \( H_0 \); there is sufficient evidence that fewer than 75% of customers are satisfied.
- Fail to reject \( H_0 \); there is insufficient evidence that fewer than 75% of customers are satisfied.
- Reject \( H_0 \); there is sufficient evidence that more than 75% of customers are satisfied.
- Fail to reject \( H_0 \); there is sufficient evidence that 75% of customers are satisfied.
▶️ Answer / Explanation
Step 1: Hypotheses
\( H_0: p = 0.75 \)
\( H_a: p < 0.75 \) (claim is “at least”, so test for fewer)
Step 2: Check conditions
- Random sample
- 10% condition: 80 ≤ 0.1N
- Normal approximation: \( n p_0 = 80*0.75 = 60 \ge 10 \), \( n(1-p_0) = 20 \ge 10 \)
Step 3: Test statistic
\( \hat{p} = 54/80 = 0.675 \)
\( z = \dfrac{0.675 – 0.75}{\sqrt{0.75*0.25/80}} = \dfrac{-0.075}{0.0484} \approx -1.55 \)
Step 4: P-value
Left-tailed: \( P(Z < -1.55) \approx 0.060 \)
Step 5: Decision
P-value 0.060 > 0.05 → fail to reject \( H_0 \)
Step 6: Conclusion in context
There is insufficient evidence to conclude that fewer than 75% of customers are satisfied. The coffee shop’s claim that at least 75% are satisfied is consistent with the sample data.
Correct Answer: B