AP Statistics 7.5 Carrying Out a Test for a Population Mean Study Notes
AP Statistics 7.5 Carrying Out a Test for a Population Mean Study Notes- New syllabus
AP Statistics 7.5 Carrying Out a Test for a Population Mean Study Notes -As per latest AP Statistics Syllabus.
LEARNING OBJECTIVE
- The t-distribution may be used to model variation.
Key Concepts:
- Calculating the Test Statistic for a Population Mean (Unknown \(\sigma\)) and Matched Pairs
- Interpreting the P-Value for a t-Test for a Population Mean (Unknown \(\sigma\)) and Matched Pairs
- Justifying a Claim Based on a Significance Test for a Population Mean (Unknown \(\sigma\)) and Matched Pairs
Calculating the Test Statistic for a Population Mean (Unknown \(\sigma\)) and Matched Pairs
To perform a t-test for a population mean or the mean difference in matched pairs, the test statistic compares the sample estimate to the hypothesized population value, standardized by the standard error.
Test statistic formula (single sample mean):
\( t = \dfrac{\bar{x} – \mu_0}{s / \sqrt{n}} \)
Test statistic formula (matched pairs / mean difference):
\( t = \dfrac{\bar{d} – \mu_{d,0}}{s_d / \sqrt{n}} \)
- \(\bar{x}\) = sample mean, \(\bar{d}\) = mean of paired differences
- \(\mu_0\) = hypothesized population mean, \(\mu_{d,0}\) = hypothesized mean difference
- \(s\) = sample standard deviation, \(s_d\) = standard deviation of differences
- \(n\) = sample size (or number of pairs)
Null distribution:
- Assuming all conditions are satisfied and \(H_0\) is true, the test statistic follows a t-distribution with \(df = n – 1\).
- This distribution is used to calculate p-values and make decisions about the null hypothesis.
Example
A nutritionist wants to test if a new diet program changes average cholesterol levels. A sample of 10 participants has pre- and post-program differences with \(\bar{d} = -8\) mg/dL and \(s_d = 5\) mg/dL. Test at \(\alpha = 0.05\) whether the diet has an effect.
▶️ Answer / Explanation
Step 1: Null and alternative hypotheses:
\( H_0: \mu_d = 0 \) (no change), \( H_a: \mu_d \ne 0 \) (any change)
Step 2: Test statistic:
\( t = \dfrac{\bar{d} – \mu_{d,0}}{s_d / \sqrt{n}} = \dfrac{-8 – 0}{5 / \sqrt{10}} = \dfrac{-8}{1.581} \approx -5.06 \)
Step 3: Degrees of freedom: \( df = 10 – 1 = 9 \)
Step 4: p-value: Using t-distribution (two-sided), \( p < 0.001 \)
Conclusion: Since \( p < 0.05 \), reject \( H_0 \). The diet program significantly changes cholesterol levels.
Interpreting the P-Value for a t-Test for a Population Mean (Unknown \(\sigma\)) and Matched Pairs
The p-value is the probability of obtaining a test statistic as extreme or more extreme than the observed value, assuming the null hypothesis is true and all conditions for the t-test are satisfied.
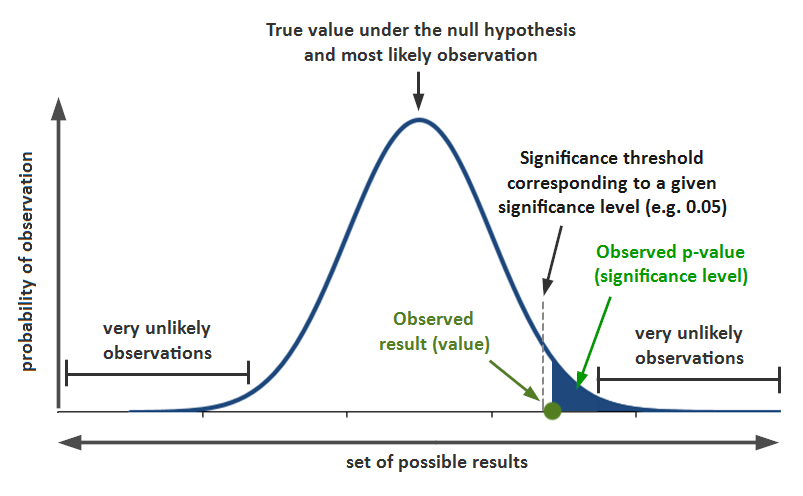
Small p-value (\(p \le \alpha\)):
The observed data would be unusual if \(H_0\) were true; this provides evidence against \(H_0\) and supports the alternative hypothesis.
Large p-value (\(p > \alpha\)):
The observed data are consistent with \(H_0\); there is insufficient evidence to support the alternative hypothesis.
- For matched pairs, the p-value is based on the t-statistic calculated from the sample of differences \(d\).
Example
A fitness program claims to increase average push-ups. A sample of 12 participants shows a mean increase of \(\bar{d} = 5.5\) push-ups with \(s_d = 2.5\). Using a t-test, the calculated t-statistic is \(t = 8.6\) with \(df = 11\). Find and interpret the p-value at \(\alpha = 0.05\).
▶️ Answer / Explanation
Step 1: Determine the p-value:
Using a t-distribution with \(df = 11\), the two-sided p-value for \(t = 8.6\) is very small, \(p < 0.001\).
Step 2: Compare with significance level \(\alpha = 0.05\):
\(p < 0.05\), so we reject \(H_0\).
Step 3: Interpretation:
The probability of observing a mean increase as large as 5.5 push-ups (or larger) if the program had no effect is extremely low.
This provides strong evidence that the fitness program increases the average number of push-ups.
Justifying a Claim Based on a Significance Test for a Population Mean (Unknown \(\sigma\)) and Matched Pairs
After performing a t-test, the claim about the population is justified by comparing the p-value to the significance level \(\alpha\) and interpreting the results in context.
Significance level (\(\alpha\)): The maximum probability of making a Type I error (rejecting \(H_0\) when it is true).
Decision rule:
- If \(p \le \alpha\), reject \(H_0\): sufficient evidence to support the alternative hypothesis.
- If \(p > \alpha\), fail to reject \(H_0\): insufficient evidence to support the alternative hypothesis.
Contextual conclusion: The decision must include reference to the population and variable under study.
Important notes:
- Rejecting \(H_0\) does not prove the alternative is true; it provides evidence in its favor.
- Failing to reject \(H_0\) does not prove it is true; it indicates insufficient evidence for \(H_a\).
Example
A school claims that a new teaching method increases the average math test score. A sample of 15 students shows an average increase of \(\bar{d} = 6\) points with \(s_d = 3\). Using a t-test, \(t = 7.35\) with \(df = 14\), giving \(p < 0.001\). Interpret and justify a claim about the population.
▶️ Answer / Explanation
Step 1: Compare p-value to significance level:
– If \(\alpha = 0.05\), then \(p < 0.001 \le 0.05\).
Step 2: Decision:
– Reject \(H_0\). There is sufficient evidence to support that the new teaching method changes the average math score.
Step 3: Contextual conclusion:
– Based on the sample, the data provide strong evidence that the new teaching method increases the average math score for students in this school.