Home / AP Statistics 7.7 Justifying a Claim About the Difference of Two Means Based on a Confidence Interval Study Notes

AP Statistics 7.7 Justifying a Claim About the Difference of Two Means Based on a Confidence Interval Study Notes

AP Statistics 7.7 Justifying a Claim About the Difference of Two Means Based on a Confidence Interval Study Notes- New syllabus

AP Statistics 7.7 Justifying a Claim About the Difference of Two Means Based on a Confidence Interval Study Notes -As per latest AP Statistics Syllabus.

LEARNING OBJECTIVE

  • An interval of values should be used to estimate parameters, in order to account for uncertainty

Key Concepts:

  • Interpreting a Confidence Interval for a Difference of Two Population Means (\(\mu_1 – \mu_2\))
  • Justifying a Claim Based on a Confidence Interval for a Difference of Two Population Means (\(\mu_1 – \mu_2\))
  • Effects of Sample Size on the Width of a Confidence Interval for the Difference of Two Means (\(\mu_1 – \mu_2\))

AP Statistics -Concise Summary Notes- All Topics

Interpreting a Confidence Interval for a Difference of Two Population Means (\(\mu_1 - \mu_2\))

Interpreting a Confidence Interval for a Difference of Two Population Means (\(\mu_1 – \mu_2\))

A confidence interval for \(\mu_1 – \mu_2\) provides a range of plausible values for the difference between two population means based on sample data.

Key concepts:

  • In repeated random sampling with the same sample sizes, approximately \(C\%\) of confidence intervals constructed in this manner will contain the true difference \(\mu_1 – \mu_2\).
  • The interpretation should include a reference to the specific samples taken and the populations they represent.
  • If the confidence interval does not include 0, there is evidence of a difference between the populations at the given confidence level.

Example

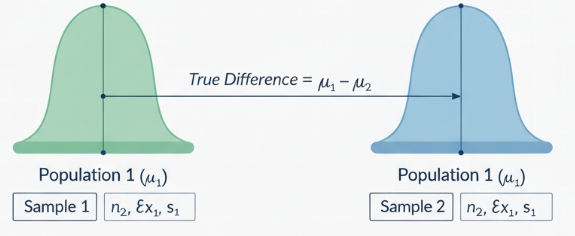
From two independent classrooms, Sample 1: \(n_1 = 25, \bar{x}_1 = 85, s_1 = 5\), Sample 2: \(n_2 = 28, \bar{x}_2 = 80, s_2 = 6\). A 95% confidence interval for the difference in means (\(\mu_1 – \mu_2\)) was calculated as [1.96, 8.04].

▶️ Answer / Explanation

Interpretation:

We are 95% confident that the true mean test score of students in Classroom 1 is between 1.96 and 8.04 points higher than that of Classroom 2.

This interpretation refers to the two samples taken and the populations they represent (students in each classroom). Since 0 is not included in the interval, there is evidence of a difference in mean test scores between the two classrooms.

Justifying a Claim Based on a Confidence Interval for a Difference of Two Population Means (\(\mu_1 - \mu_2\))

Justifying a Claim Based on a Confidence Interval for a Difference of Two Population Means (\(\mu_1 – \mu_2\))

A confidence interval for \(\mu_1 – \mu_2\) provides a range of plausible values for the difference in population means. This range can be used to evaluate claims about which population mean is larger or whether a difference exists.

Key concepts:

  • If the confidence interval for \(\mu_1 – \mu_2\) does not include 0, there is evidence that the population means are different, which may support a claim about a difference.
  • If the confidence interval includes 0, there is insufficient evidence to support a claim that the population means differ.
  • Interpretation should be stated in context, referencing the populations and samples.

Example

Two teaching methods are compared: Sample 1 (n₁=25) has mean 85, Sample 2 (n₂=28) has mean 80. A 95% confidence interval for the difference (\(\mu_1 – \mu_2\)) is [1.96, 8.04].

▶️ Answer / Explanation

The confidence interval does not include 0, indicating that Classroom 1 likely has a higher mean test score than Classroom 2.

This supports the claim that the teaching method used in Classroom 1 results in higher average scores. The interpretation refers specifically to the sampled classrooms and the populations they represent.

Effects of Sample Size on the Width of a Confidence Interval for the Difference of Two Means (\(\mu_1 - \mu_2\))

Effects of Sample Size on the Width of a Confidence Interval for the Difference of Two Means (\(\mu_1 – \mu_2\))

The width of a confidence interval depends on the standard error of the estimate and the critical value for the confidence level.

Key concepts:

  • The standard error for the difference of two means is \( SE = \sqrt{\dfrac{s_1^2}{n_1} + \dfrac{s_2^2}{n_2}} \).
  • Increasing the sample sizes (\(n_1\) and \(n_2\)) decreases the standard error, which in turn decreases the width of the confidence interval.
  • All other factors (confidence level, variability) remaining the same, larger samples provide more precise estimates of \(\mu_1 – \mu_2\).

Example

Two teaching methods are compared. Initial sample sizes: \(n_1 = 25\), \(n_2 = 28\), with standard deviations \(s_1 = 5\), \(s_2 = 6\). A 95% confidence interval for \(\mu_1 – \mu_2\) has width ≈ 6.08.

If both sample sizes are increased to \(n_1 = 50\) and \(n_2 = 56\), keeping the same sample means and standard deviations, compute the new standard error and interval width.

▶️ Answer / Explanation

Step 1: Compute new standard error:

\( SE = \sqrt{\dfrac{5^2}{50} + \dfrac{6^2}{56}} = \sqrt{0.5 + 0.643} = \sqrt{1.143} \approx 1.069 \)

Step 2: Multiply by \(t^* \approx 2.009\) (95% CI) to get margin of error:

\( ME = 2.009 \cdot 1.069 \approx 2.15 \)

Step 3: Compute width of CI:

Width = 2 × ME ≈ 4.30

Conclusion: Doubling the sample sizes reduced the confidence interval width from ≈6.08 to ≈4.30, providing a more precise estimate of the difference in population means.

Scroll to Top