AP Statistics 7.8 Setting Up a Test for the Difference of Two Population Means Study Notes
AP Statistics 7.8 Setting Up a Test for the Difference of Two Population Means Study Notes- New syllabus
AP Statistics 7.8 Setting Up a Test for the Difference of Two Population Means Study Notes -As per latest AP Statistics Syllabus.
LEARNING OBJECTIVE
- The t-distribution may be used to model variation.
Key Concepts:
- Selecting an Appropriate Testing Method for a Difference of Two Population Means (\(\mu_1 – \mu_2\))
- Null and Alternative Hypotheses for a Difference of Two Population Means (\(\mu_1 – \mu_2\))
- Verifying Conditions for a Significance Test for a Difference of Two Population Means (\(\mu_1 – \mu_2\))
Selecting an Appropriate Testing Method for a Difference of Two Population Means (\(\mu_1 - \mu_2\))
Selecting an Appropriate Testing Method for a Difference of Two Population Means (\(\mu_1 – \mu_2\))
When comparing two population means, the choice of inference procedure depends on the type of data, the sample sizes, and what is known about population standard deviations.
Key concepts:
- When the population standard deviations (\(\sigma_1, \sigma_2\)) are unknown and estimated using sample standard deviations (\(s_1, s_2\)), use a two-sample t-test for the difference of means.
- Samples must be independent and randomly selected from each population.
- Population distributions should be approximately normal, or sample sizes should be large (\(n_1, n_2 \ge 30\)) so the Central Limit Theorem applies.
- For paired data, use a paired t-test on the differences of the paired observations.
Example
A researcher wants to compare the mean test scores of students taught using two different methods. Sample 1 (n₁ = 25) has mean 85 and standard deviation 5. Sample 2 (n₂ = 28) has mean 80 and standard deviation 6. Population standard deviations are unknown.
▶️ Answer / Explanation
Since the population standard deviations are unknown and samples are independent, the appropriate method is a two-sample t-test for the difference in means.
If the samples were paired (e.g., same students before and after a teaching method), a paired t-test on the differences would be used instead.
Null and Alternative Hypotheses for a Difference of Two Population Means (\(\mu_1 - \mu_2\))
Null and Alternative Hypotheses for a Difference of Two Population Means (\(\mu_1 – \mu_2\))
Hypothesis tests about the difference of two population means evaluate whether there is evidence that the two population means differ in a specified direction or in general.
Key concepts:
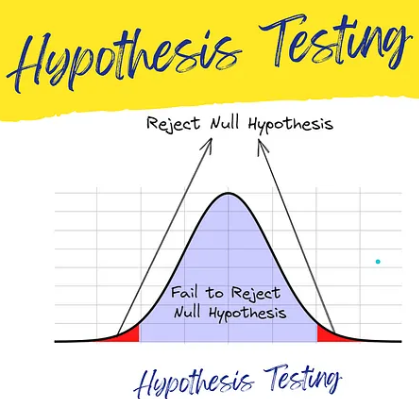
Null hypothesis (\(H_0\)): There is no difference between the population means. Typically, \(H_0: \mu_1 – \mu_2 = 0\).
Alternative hypothesis (\(H_a\)): States the research claim and can be:
- Two-sided: \(H_a: \mu_1 – \mu_2 \ne 0\) (the means are different)
- One-sided: \(H_a: \mu_1 – \mu_2 > 0\) or \(H_a: \mu_1 – \mu_2 < 0\) (the means differ in a specified direction)
The hypotheses should always be stated in context, referring to the populations being compared.
Example
A school wants to compare average test scores between two teaching methods. Sample 1: n₁ = 25, Sample 2: n₂ = 28. The research claim is that Method 1 leads to higher scores than Method 2.
▶️ Answer / Explanation
Step 1: State the null hypothesis:
\(H_0: \mu_1 – \mu_2 = 0\) (no difference in mean scores)
Step 2: State the alternative hypothesis based on the claim:
\(H_a: \mu_1 – \mu_2 > 0\) (Method 1 has higher mean scores than Method 2)
Verifying Conditions for a Significance Test for a Difference of Two Population Means (\(\mu_1 - \mu_2\))
Verifying Conditions for a Significance Test for a Difference of Two Population Means (\(\mu_1 – \mu_2\))
Before performing a two-sample t-test for a difference of population means, certain conditions must be checked to ensure valid statistical inference.
Conditions:
Randomness: The data should come from independent random samples or a randomized experiment.
Independence of samples: The two samples must be independent of each other.
Normality or large sample sizes:
- Each population should be approximately normal, or
- Sample sizes should be large (\(n_1 \ge 30\) and \(n_2 \ge 30\)) so that the sampling distribution of \(\bar{x}_1 – \bar{x}_2\) is approximately normal by the Central Limit Theorem.
10% condition for sampling without replacement: When sampling without replacement, \(n_1 \le 0.1N_1\) and \(n_2 \le 0.1N_2\).
Example
A researcher compares test scores from two independent classrooms. Sample 1: n₁ = 25, Sample 2: n₂ = 28. Both populations are approximately normal. Sampling is random and independent.
▶️ Answer / Explanation
Step 1: Randomness – samples were randomly selected → condition satisfied.
Step 2: Independence – samples are from different classrooms → condition satisfied.
Step 3: Normality – populations approximately normal → condition satisfied.
Step 4: 10% condition – sample sizes are small relative to population sizes → condition satisfied.
Conclusion: All conditions are met; a two-sample t-test for the difference in means can be performed.
