Expected Counts for Two-Way Tables
In two-way tables (contingency tables), expected counts represent the counts we would expect in each cell if the two categorical variables are independent.
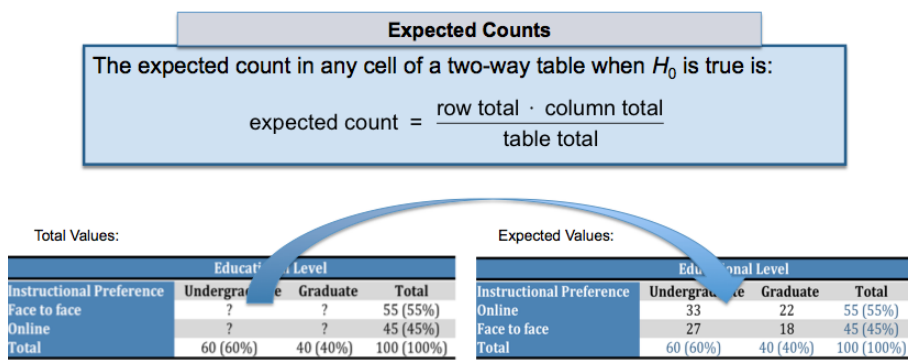
Formula:
\(\displaystyle E_{ij} = \frac{(\text{row total}_i)(\text{column total}_j)}{\text{grand total}}\)
- \(E_{ij}\) = expected count for the cell in row \(i\) and column \(j\)
- \(\text{row total}_i\) = total count for row \(i\)
- \(\text{column total}_j\) = total count for column \(j\)
- \(\text{grand total}\) = total number of observations
Notes:
- Expected counts are calculated under the assumption of independence between the row and column variables.
- All expected counts should be at least 5 for the chi-square test to be valid.
Example
A survey asks 100 students about their favorite snack (Chips, Candy) and gender (Male, Female). The observed counts are:
| Chips | Candy | Row Total | |
|---|---|---|---|
| Male | 30 | 20 | 50 |
| Female | 10 | 40 | 50 |
| Column Total | 40 | 60 | 100 |
Calculate the expected counts for each cell assuming independence of gender and snack preference.
▶️ Answer / Explanation
Step 1 — Apply the formula:
\(E_{ij} = \frac{(\text{row total}_i)(\text{column total}_j)}{\text{grand total}}\)
- Male & Chips: \(E = \frac{50 \times 40}{100} = 20\)
- Male & Candy: \(E = \frac{50 \times 60}{100} = 30\)
- Female & Chips: \(E = \frac{50 \times 40}{100} = 20\)
- Female & Candy: \(E = \frac{50 \times 60}{100} = 30\)
Step 2 — Interpretation: These are the counts we would expect in each category if gender and snack preference were independent.