AP Statistics 9.5 Carrying Out a Test for the Slope of a Regression Model Study Notes
AP Statistics 9.5 Carrying Out a Test for the Slope of a Regression Model Study Notes- New syllabus
AP Statistics 9.5 Carrying Out a Test for the Slope of a Regression Model Study Notes -As per latest AP Statistics Syllabus.
LEARNING OBJECTIVE
- The t-distribution may be used to model variation.
Key Concepts:
- Calculating the Test Statistic for the Slope (\(\beta\)) of a Regression Model
- Interpreting the p-value for a Significance Test of the Slope (\(\beta\))
- Justifying a Claim About the Population Based on a Significance Test for the Slope (\(\beta\))
Calculating the Test Statistic for the Slope (\(\beta\)) of a Regression Model
To test hypotheses about the population slope \(\beta\), we calculate a t-test statistic using the sample slope \(b\) and its standard error \(SE_b\).
Test statistic formula:
\( t = \dfrac{b – \beta_0}{SE_b} \)
- \(b\) = sample slope from the regression line \(\hat{y} = a + bx\)
- \(\beta_0\) = hypothesized population slope under the null hypothesis (often 0)
- \(SE_b\) = standard error of the slope
Null distribution:
Assuming all conditions for regression inference are satisfied and \(H_0: \beta = \beta_0\) is true, the test statistic \(t\) follows a t-distribution.
For a simple linear regression with one explanatory variable, the degrees of freedom is:
\( df = n – 2 \)
- This accounts for the estimation of two parameters: the intercept (\(a\)) and the slope (\(b\)).
- The t-distribution with \(df = n-2\) is used as the null distribution to calculate p-values and make statistical conclusions about \(\beta\).
Interpretation:
- A large absolute value of the test statistic indicates the observed slope is far from the null hypothesis value and provides evidence against \(H_0\).
- The sign of \(t\) indicates the direction of the relationship (positive or negative).
- Smaller degrees of freedom result in a wider t-distribution, while larger df make the t-distribution closer to the standard normal distribution.
Example
A study investigates whether hours of weekly exercise (\(x\)) affect resting heart rate (\(y\)) in adults. A sample of 12 adults yields a regression line \(\hat{y} = 80 – 1.5x\), with standard error of the slope \(SE_b = 0.5\).
Calculate the t-test statistic for testing \(H_0: \beta = 0\) against \(H_a: \beta \ne 0\).
▶️ Answer / Explanation
Step 1 — Identify the formula:
\( t = \dfrac{b – \beta_0}{SE_b} \)
Step 2 — Substitute the values:
\( t = \dfrac{-1.5 – 0}{0.5} = \dfrac{-1.5}{0.5} = -3.0 \)
Step 3 — Determine the null distribution:
The t-statistic follows a t-distribution with \(df = n-2 = 12-2 = 10\).
Step 4 — Interpretation:
The test statistic \(t = -3.0\) indicates that the observed negative slope is 3 standard errors below the null value, providing evidence against \(H_0: \beta = 0\) and supporting a negative relationship between exercise and resting heart rate.
Interpreting the p-value for a Significance Test of the Slope (\(\beta\))
The p-value measures the strength of evidence against the null hypothesis \(H_0: \beta = \beta_0\) in a regression model. It is based on the t-test statistic calculated for the sample slope \(b\).
The p-value is the probability of observing a test statistic as extreme or more extreme than the one obtained from the sample, assuming the null hypothesis is true and all conditions for inference are satisfied.
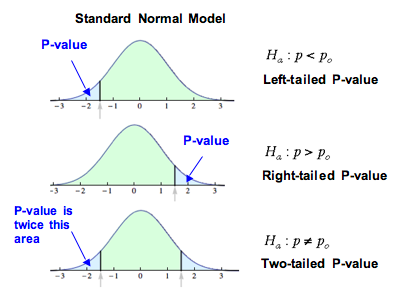
For a two-sided test
(\(H_a: \beta \ne 0\)), the p-value corresponds to the probability that \(t\) is at least as far from 0 as the observed t-statistic in either direction.
For a one-sided test
(\(H_a: \beta > 0\) or \(H_a: \beta < 0\)), the p-value corresponds to the probability that \(t\) is as extreme as observed in the direction specified by the alternative hypothesis.
Interpretation:
- A small p-value (typically < 0.05) indicates strong evidence against \(H_0\), suggesting that there is a statistically significant linear relationship between \(x\) and \(y\) in the population.
- A large p-value indicates weak evidence against \(H_0\), suggesting that the observed slope could plausibly occur by random chance if \(\beta = \beta_0\).
- The p-value does not measure the size or importance of the slope, only the strength of evidence against the null hypothesis.
Example
A researcher studies whether weekly hours of study (\(x\)) affect exam scores (\(y\)) in college students. A sample of 20 students yields a regression slope \(b = 2.5\) with standard error \(SE_b = 0.8\). The calculated t-test statistic is \(t = 3.125\), and the corresponding two-sided p-value is 0.005.
Interpret the p-value in the context of the study.
▶️ Answer / Explanation
Step 1 — Identify the null hypothesis:
\(H_0: \beta = 0\) (no linear relationship between hours of study and exam score).
Step 2 — Examine the p-value:
The p-value is 0.005, which is very small (less than 0.05).
Step 3 — Interpret:
Since the p-value is small, the observed slope of 2.5 is unlikely to occur if there were no relationship between study hours and exam scores. This provides strong evidence against the null hypothesis.
Conclusion: There is statistically significant evidence that more hours of study are associated with higher exam scores in the population of college students.
Justifying a Claim About the Population Based on a Significance Test for the Slope (\(\beta\))
After calculating the t-test statistic and corresponding p-value for the slope in a regression model, we can make a formal decision about the null hypothesis and use it to justify a claim about the population.
Step 1 : State the significance level (\(\alpha\)): Common choices are 0.05, 0.01, or 0.10.
Step 2 : Compare the p-value to \(\alpha\):
- If \(p \leq \alpha\), reject \(H_0: \beta = 0\).
- If \(p > \alpha\), fail to reject \(H_0\).
Step 3 : Draw a conclusion in context:
- Rejecting \(H_0\) indicates sufficient statistical evidence that there is a linear relationship between \(x\) and \(y\) in the population.
- Failing to reject \(H_0\) indicates insufficient evidence to support a linear relationship; this does not prove \(H_0\) is true.
Step 4 : Justify the claim about the population:
- Use the result of the significance test to make a statement about the population slope \(\beta\).
- Example: “There is significant evidence in the population that more study hours are associated with higher exam scores.”
Notes:
- Small p-values indicate strong evidence for the alternative hypothesis; larger p-values indicate weak evidence.
- The conclusion must always be stated in context, referring to both the explanatory and response variables.
Example
A researcher investigates whether daily exercise (\(x\)) affects resting heart rate (\(y\)) in adults. A sample of 15 adults yields a regression slope \(b = -0.8\) with standard error \(SE_b = 0.3\). The calculated t-statistic is \(t = -2.67\), and the two-sided p-value is 0.018. The significance level is \(\alpha = 0.05\).
Can the researcher justify a claim that more exercise reduces resting heart rate in the population?
▶️ Answer / Explanation
Step 1 — Compare the p-value to \(\alpha\):
p-value = 0.018 < 0.05, so we reject \(H_0: \beta = 0\).
Step 2 — Conclusion about the alternative hypothesis:
There is sufficient statistical evidence to support the claim that a linear relationship exists between daily exercise and resting heart rate.
Step 3 — Justify the claim in context:
The negative slope (\(b = -0.8\)) indicates that more daily exercise is associated with lower resting heart rate in the population of adults.
Conclusion: Based on the significance test, the researcher can justify the claim that increased exercise reduces resting heart rate in adults.