1. Question:
Topic – 2.1 Cell Structure and Function
(a) – 2.6 Facilitated Diffusion
(b) – 2.5 Membrane Transport
(c) – 2.5 Membrane Transport
(d) – 2.5 Membrane Transport
Polycystic kidney disease (PKD) is an inherited disease that causes water loss from the body and affects cell division in the kidneys. Because water movement across cell membranes is related to ion movement, scientists investigated the role of the Na+ /K+ ATPase (also known as the sodium/potassium pump) in this disease. Ouabain, a steroid hormone, binds to the Na+ /K+ ATPase in plasma membranes. Individuals with PKD have a genetic mutation that results in an increased binding of ouabain to the Na+ /K+ ATPase. The scientists treated normal human kidney (NHK) cells and PKD cells with increasing concentrations of ouabain and measured the number of cells (Figure 1) and the activity of the Na+ /K+ ATPase (Figure 2) after a period of time. The scientists hypothesized that a signal transduction pathway that includes the protein kinases MEK and ERK (Figure 3) may play a role in PKD symptoms.
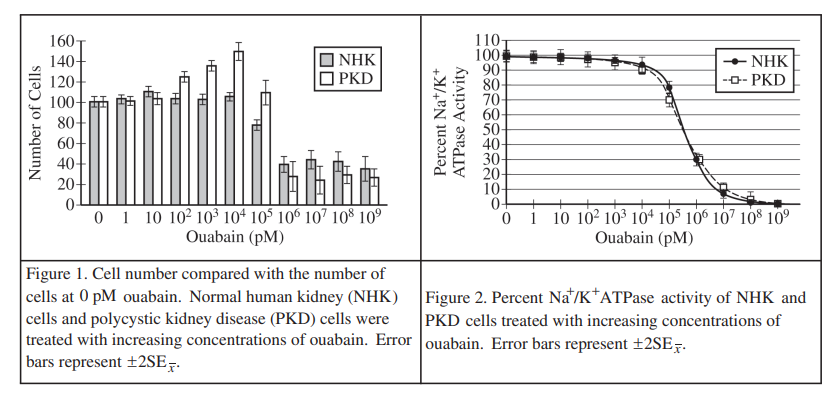
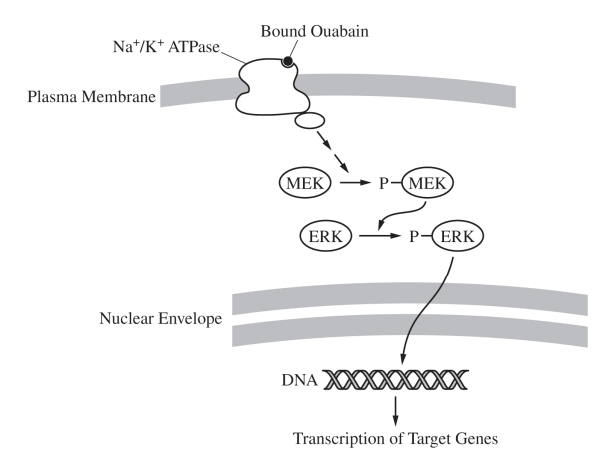
Figure 3. Signal transduction pathway hypothesized to play a role in the increased number of PKD cells
(a) Describe the characteristics of the plasma membrane that prevent simple diffusion of Na+ and K+ across the membrane. Explain why ATP is required for the activity of the Na+ /K+ ATPase.
(b) Identify a dependent variable in the experiment represented in Figure 1. Justify the use of normal human kidney (NHK) cells as a control in the experiments. Justify the use of a range of ouabain concentrations in the experiment represented in Figure 1.
(c) Based on the data shown in Figure 2, describe the relationship between the concentration of ouabain and the Na+ /K+ ATPase activity both in normal human kidney (NHK) cells AND in PKD cells. The scientists determined that Na+ /K+ ATPase activity in PKD cells treated with 1 pM ouabain is 150 units of ATP hydrolyzed/sec. Calculate the expected Na+ /K+ ATPase activity (units/sec) in PKD cells treated with 106 pM ouabain.
(d) In a third experiment, the scientists added an inhibitor of phosphorylated MEK (pMEK) to the PKD cells exposed to 104 pM ouabain. Based on Figure 3, predict the change in the relative ratio of ERK to pERK in ouabain-treated PKD cells with the inhibitor compared with ouabain-treated PKD cells without the inhibitor. Provide reasoning to justify your prediction. Using the data in Figure 1 AND the signal transduction pathway represented in Figure 3, explain how the concentration of cyclin proteins may increase in PKD cells treated with 104 pM ouabain.
Answer/Explanation
Ans:
(a) Describe the characteristics of the plasma membrane that prevent simple diffusion of Na+ and K+ across the membrane.
Accept one of the following:
• The interior of the plasma membrane is hydrophobic/nonpolar.
• The phospholipid tails are hydrophobic/nonpolar.
• The exterior of the plasma membrane is hydrophilic/polar.
• The phospholipid heads are hydrophilic/polar.
Explain why ATP is required for the activity of the Na+ /K+ ATPase .
• The Na /K ATPase + + pumps ions against their concentration gradients. This requires
an input of (metabolic) energy.
(b) Use the template provided to construct an appropriately labeled graph based on the data in Table 1.

• Point distribution: Axis labels; plotting in a bar graph or modified bar graph; error bars
Determine one individual who is both at risk of developing the disorder and has a significantly different blood glucose level from that of individual IV-1.
• IV-3
(c) Based on the pedigree, identify all individuals in generation IV who can pass on the mutation to their children.
• IV-1, IV-2, IV-4
(d) Based on the fact that individual II-2 is affected, a student claims that the disorder is inherited in an X-linked recessive pattern. Based on the student’s claim, predict which individuals of generation III will be affected by the disorder.
• III-4 and III-8
Based on the pedigree, justify why the data do NOT support the student’s claim.
Accept one of the following:
• The data do not support the claim because females III-2 and III-6 have the disorder and, if inheritance is X-linked recessive, they could only do so if their father II-1 had the disorder, which he does not.
• The data instead support mitochondrial inheritance, because all of the offspring of individual II-2 , not only the sons, have the disorder.
The Plasma membrane is composed of phospholipids, which have a hydrophilic phosphate head and incurred facing hydrophobic fatty and tails. This plasma membrane is sripomeable meaning that only ronpdar, small substances can undergo simple diffusion through this membrane. Since Na+ and K+ are ions, (they have an electric change) they must enter the cell through transport proteins since can’t diffuse through membrane. Because cells create a gradient of K+ ions within the e.i, ATP is required for he transport protein Na+ /K+ ATPose. Since the cell is bringing in more K+ ions against their concentration gradient and pumping out Na+ ions against their concentration gradient, energy in the form of ATP is necessary for this protein to work.
Dependent variable is the number of resulting NHK and PKD cells following different concentrations of obtain NHK cells serve as a model to compare the cellular changes caused by obtain in PKD cells, since the values collected would be insignifigent without a relevant comparison. Using a range of obtain concentrations allowed the researches to observe the changes that occur in cells in multiple conditions, since a very small amount of obtain may have a very different effect on Hinchey cells compared to a very high amount.
In both normal kidney cells and PKD cells, as concentration of obtain increases past 104 PM, a drastic decrease in Na+ /K+ ATPose occurs. So there is a negative relationship between obtain and Na+ /K+ ATPose activity. In PKD cells treated with 106 pM obtain, Na+ /K+ ATPose activity is 45 units of ATP hydrolyzed per second.
The relative ratio of ERk to pERK will increase in cells treated with the inhibiter compared to cells not treated with the inhibiter. Since PMEk signals the transfer of ERK to PERK, if this PMEk is inhibited, it wan’t allow for the phosphorylation of ERk to PERk and the amount of ERk will increase relative to PERk, causing an increase in ration.
Obtain is a signaling molecule that causes the transcription of target goes in Hinchey cells. Since PKD cells have increased binding of obtain, and cells in a concentration of 104 obtain have significantly higher levels of cells; it can be inferred that obtain increase transcription of cyclin goes, which promote cell growth+ duisun, as shown in figure 1.
2. Question:
Topic – 2.5 Membrane Transport
(a) – 2.5 Membrane Transport
(b) – 2.5 Membrane Transport
(c) – 2.5 Membrane Transport
(d) -2.5 Membrane Transport
Geneticists investigated the mode of inheritance of a rare disorder that alters glucose metabolism and first shows symptoms in adulthood. The geneticists studied a family in which some individuals of generations II and III are known to have the disorder. Based on the pedigree (Figure 1), the geneticists concluded that the disorder arose in individual II−2 and was caused by a mutation in mitochondrial DNA.


(a) The disorder alters glucose metabolism. Describe the atoms AND types of bonds in a glucose molecule.
(b) Using the template in the space provided for your response, construct an appropriately labeled graph based on the data in Table 1. Determine one individual who is both at risk of developing the disorder and has a significantly different blood glucose level from that of individual IV−1.1.
(c) Based on the pedigree, identify all individuals in generation IV who can pass on the mutation to their children.
(d) Based on the fact that individual II−2 is affected, a student claims that the disorder is inherited in an X-linked recessive pattern. Based on the student’s claim, predict which individuals of generation III will be affected by the disorder. Based on the pedigree, justify why the data do NOT support the student’s claim.
Answer/Explanation
Ans:
(a) The disorder alters glucose metabolism. Describe the atoms AND types of bonds in a glucose molecule.
• The atoms are carbon, hydrogen, and oxygen (C, H, and O) and are held together by covalent bonds.
(b) Use the template provided to construct an appropriately labeled graph based on the data in Table 1.

• Point distribution: Axis labels; plotting in a bar graph or modified bar graph; error bars
Determine one individual who is both at risk of developing the disorder and has a significantly different blood glucose level from that of individual IV-1.
• IV-3
(c) Based on the pedigree, identify all individuals in generation IV who can pass on the mutation to their children.
• IV-1, IV-2, IV-4
(d) Based on the fact that individual II-2 is affected, a student claims that the disorder is inherited in an X-linked recessive pattern. Based on the student’s claim, predict which individuals of generation III will be affected by the disorder.
• III-4 and III-8
Based on the pedigree, justify why the data do NOT support the student’s claim.
Accept one of the following:
• The data do not support the claim because females III-2 and III-6 have the disorder and, if inheritance is X-linked recessive, they could only do so if their father II-1 had the disorder, which he does not.
• The data instead support mitochondrial inheritance, because all of the offspring of individual II-2 , not only the sons, have the disorder.

(a) accuse is made of carbon, Hydrogen, and Oxygen its formula is C6H12O6, the bands found between these atoms in a glucose molecule are covalent bands.
(b) One individual who is at risk of developing the disorder with a significantly different blood glucose level than IV-4 is IV-3. We know this because the error bars on the graph do not overlap making the difference in blood glucose level of IV-1 and IV-3 significantly different.
(c) The individuals that can pass on the mutation are individuals IV-1, IV-2 IV-4. This trait is found in mitochondrial so it is only passed down by females with the trait. Since in generation IV only individuals 1, 2 and 4 are female and have parents with the trait and show at risk blood glucose levels they can pass the mutation to their children.
(d) Based on the students claim all of the male offspring of II-2 will have the trait although no females will have it because it is a recessive disorder and their father has the dominant trait which will be expressed. The individuals predicted to have it based on the students claim are 4, 8 in generation III. The data does not support the students claim because the trait is found in mitochondrial DNA which is passed down by the mother and not autosomal DNA which is from both parents. For this reason, all of II-2 offspring will have he mutation.
4. Question:
Topic – 7.2 Natural Selection
(a) – 7.2 Natural Selection
(b) – 7.2 Natural Selection
(c) – 7.2 Natural Selection
(d) – 7.2 Natural Selection
In 1981 a single immature male Geospiza conirostris finch flew more than 100 kilometers from the Galápagos island of Española to the Galápagos island of Daphne Major, where no G. conirostris finches were living. The immigrant finch bred with a female G. fortis, a species of finch common on Daphne Major. The \(F_{1}\) finches and later generations interbred only within their lineage. By 2012 scientists counted 23 individuals, including eight breeding pairs, within this hybrid lineage on Daphne Major. The hybrid lineage became known as Big Bird.
Birds with different beak shapes and sizes eat different types of food. The dimensions of the Big Bird beaks relative to the beaks of the major competitor finch species on Daphne Major are shown in Figure 1.

Figure 1. The dimensions of the beaks of the Big Bird lineage and of its major competitor species in 2012 on Daphne Major. Each symbol represents the beak dimensions of a single bird.
(a) The Big Bird lineage became reproductively isolated from G. fortis. Describe one prezygotic mechanism that likely contributed to the reproductive isolation of the Big Bird lineage from G. fortis.
(b) Based on the data in Figure 1, explain why the Big Bird population has been able to survive and reproduce on Daphne Major.
(c) A virus infects and kills all G. magnirostris on Daphne Major but does not affect the other finch species. Assuming food type and availability stay the same, predict the most likely change in the beak phenotype of the Big Bird population after six more generations.
(d) Provide reasoning to justify your prediction in part (c).
Answer/Explanation
Ans:
(a) The Big Bird lineage became reproductively isolated from G. fortis. Describe one prezygotic mechanism that likely contributed to the reproductive isolation of the Big Bird lineage from G. fortis.
Accept one of the following:
• Beak shape/size or song or behavior or mechanical/chemical differences or time of mating or location on the island or primary food source differs between the Big Bird lineage and G. fortis.
• Description of another mechanism that prevents males and females from different populations from encountering each other/recognizing each other as potential mates.
(b) Based on the data in Figure 1, explain why the Big Bird population has been able to survive and reproduce on Daphne Major.
• The birds have a beak size/shape that differs from the beaks of the competitor finches on the island. Thus, they probably do not compete with the other finch species for food but instead, eat food that the other finches do not consume.
(c) A virus infects and kills all G. magnirostris on Daphne Major but does not affect the other finch species. Assuming food type and availability stay the same, predict the most likely change in the beak phenotype of the Big Bird population after six more generations.
Accept one of the following predictions:
- Option 1: The (mean) beak size will increase (in the population).
- Option 2: The (average) beak (in the population) will be longer and deeper.
- Option 3: The frequency of large beaks will increase (in the population).
- Option 4: The (mean) beak size will stay the same (in the population).
(d) Provide reasoning to justify your prediction in part (c).
Accept one of the following:
• Justification for options 1, 2, and 3: There will be directional selection for larger beaks because larger seeds are more accessible.
• Justification for option 4: There is little genetic diversity because all birds are descended from a single pair, and the birds are only six generations from the founder.
(a) One prezygotic me chain that isolated big bind from 6 fortis is making rituals. As big bind formed into a new species, making patterns may have shifted so 6 fortis did not recognize them.
(b) The big bind population has been able to survive and reproduce on paphare Major because true beak size and shape is unique. Big binds unique beak size and shape allows it to occupy a unique ecological niche, where it is not in constant completion for food.
(c) I predict that big bind’s beak phenotype will increase in length and depth after six generation.
(d) Big bind’s beak will increase in size because it provives a selective advantage. By having a larger beak, Big bind will be able to expand their ecological niche into 6 magnirostis’s former niche. This will increase food supply, so natural selection will favor the big bind variations with larger beaks
5. Question:
Topic – 7.4 Populations
(a) – 7.4 Population Genetics
(b) – 7.4 Population Genetics
(c) – 7.4 Population Genetics
(d) – 7.4 Population Genetics
Annual plants complete their life cycle, including germination, seed production, and death, within one year. Ambrosia trifida (giant ragweed) is an annual plant that readily colonizes any land that has had a disturbance such as plowing. The plant is considered an invasive species in regions outside of its native range. In a particular region, the seeds of A. trifida germinate from early March through the end of the summer, while the seeds of other annual plants require warmer soil temperatures and thus germinate from late April through the end of the summer.
Researchers studied the influence of A. trifida on the biodiversity of other annual plant species that grow in the same field. In early spring, the researchers marked off identical plots of land in a field that had been plowed the previous fall and not replanted with new crops. All plants that grew on one half of the plots were left untouched (Figure 1A), while all germinating A. trifida seedlings were removed from the other half of the plots throughout the spring and summer (Figure 1B). In late summer, the researchers counted and identified all plants that grew in the plots. The distribution of plants is represented by the symbols in Figures 1A and 1B.

Figure 1. Representations of plant identity and distribution in experimental plots in late summer. Each box represents one typical experimental plot, and each symbol represents 10 individual plants.
(a) Describe a cause of logistic growth of the ragweed population.
(b) Based on the representation in Figure 1, explain why the scientists claim that plot B would be more resilient than plot A in response to a sudden environmental change.
(c) In a third group of plots, the researchers removed all seedlings of all plants that germinated before June 1. All plants that germinated after June 1 were left untouched. Using the template in the space provided for your response and the symbols shown in Figure 1, represent the expected plant species that would be found in this third group of plots three months later. Draw no more than 12 symbols. Assume all other environmental conditions are the same as for the initial study described.
(d) Explain how an invasive species such as ragweed affects ecosystem biodiversity, as illustrated in Figure 1.
Answer/Explanation
Ans:
(a) Describe a cause of logistic growth of the ragweed population.
Accept one of the following:
- A factor that becomes limiting would cause the population size to stabilize.
- Space/sunlight/herbivory/phosphorus/nitrogen/other density-dependent factor becomes limiting, and the population stabilizes.
(b) Based on the representation in Figure 1, explain why the scientists claim that plot B would be more resilient than plot A in response to a sudden environmental change.
- (Plot B is more resilient) because it has much greater (species) diversity than plot A does.
(c) In a third group of plots, the researchers removed all seedlings of all plants that germinated before June 1. All plants that germinated after June 1 were left untouched. Using the template in the space provided for your response and the symbols shown in Figure 1, represent the expected plant species that would be found in this third group of plots three months later. Draw no more than 12 symbols. Assume all other environmental conditions are the same as for the initial study described.

(d) Explain how an invasive species such as ragweed affects ecosystem biodiversity, as illustrated in Figure 1.
- The explanation requires a process or relationship – and must state that biodiversity decreases.
- Examples of appropriate responses include:
- There are no predators of the invasive species, so its population grows faster and reduces biodiversity.
- The invasive species germinates earlier, uses up resources, and reduces biodiversity.
- The invasive species outcompetes other species and reduces biodiversity.

(a) One cause of logistic growth is that the space the ragweed’s have to grow in an the field is limited so that limits the size the population can reach. It is a density dependent factor that causes the population to level off at carrying capacity instead of continues to grow exponentially (leading to logistic growth).
(b) Plot B would be more resilient because it has a greater amount of biodiversity and through that genetic diversity. This means that if a sudden change occurred in the climate there is more of a chance something will survive from B (because there are more different types of plants with different serves) then A.
(d) Incursive species rectuce biodiversity by out competing many different types of native species for resources. This causes the invasive species to take over and the different types of native species to decline leaving a lot more of one type of organism in the ecosystem than before.
6. Question:
Topic – Gene Expression and Regulation
(a) – 6.2 Regulation of Gene Expression
(b) – 6.2 Regulation of Gene Expression
(c) – 6.3 Transcription and RNA Processing
(d) – 6.4 Translation
The small invertebrate krill species Thysanoessa inermis is adapted to cold (4°C ) seawater. Over the past ten years, there has been a gradual increase in the water temperature of the krill’s habitat. A sustained increase in water temperature may ultimately affect the ability of the krill to survive.
One effect of higher temperatures is protein misfolding within cells. Krill have several hsp genes that code for heat-shock proteins (HSPs). These proteins help prevent protein misfolding or help to refold proteins to their normal shapes.
Scientists conducted experiments on T. inermis to detect changes in the expression of hsp genes when the krill were exposed to temperatures above 4°C. An experimental group of krill was maintained in tanks with 4°C seawater and then placed into tanks with 10°C seawater for approximately three hours. The krill were then given a six-hour recovery period in the 4°C seawater tanks. A control group of krill was moved from a tank of 4°C seawater to another tank of 4°C seawater for approximately three hours and then returned to the original tank. The scientists analyzed hsp gene expression by measuring the concentrations of three mRNAs (I, II, III) transcribed from certain hsp genes in both the heat-shocked krill (Figure 1) and the control krill. For the control krill, no transcription of the hsp genes was detected throughout the test period (data not shown).

Figure 1. Average concentration of three mRNAs (I, II, III) transcribed from hsp genes in krill heat shocked at 10°C. Error bars represent \(± 2SE_{\bar{x}}\).
(a) Identify the hsp mRNA that has the slowest rate of concentration increase in response to heat-shock treatment.
(b) Describe the trend in the average concentration of mRNA I throughout the experiment.
(c) The scientists hypothesized that the heat-shock protein (HSP) translated from mRNA I plays a greater role in refolding proteins than does the HSP translated from mRNA II. Use the data to support the hypothesis.
(d) mRNAs I and II are transcribed from the same gene. Explain how a cell can produce two different mRNAs from the same gene.
Answer/Explanation
Ans:
(a) Identify the hsp mRNA that has the slowest rate of concentration increase in response to heat-shock treatment.
• (mRNA) III
(b) Describe the trend in the average concentration of mRNA I throughout the experiment.
• (No change in concentration from 1 to 3 hours) increased concentration (slightly) between 3 and 6 hours/during the heat shock, increased concentration at a greater rate from 6 to 10 hours/for 4 hours after the heat shock, and then decreased concentration after hour 10.
(c) The scientists hypothesized that the heat-shock protein (HSP) translated from mRNA I plays a greater role in refolding proteins than does the HSP translated from mRNA II .
Use the data to support the hypothesis.
• mRNA I is still expressed at a high level after the heat-shock period, while mRNA II levels decrease after the heat shock, when proteins would need to be refolded.
(d) mRNAs I and II are transcribed from the same gene. Explain how a cell can produce two different mRNAs from the same gene.
Accept one of the following:
• The cell expresses different exons/performs alternative splicing.
• The cell uses different transcription termination sites (poly(A) sites).
• The cell uses different promoters.
(a) The hsp mRNA III has the slowest rate of concentration increase in response to heat-shock treatment, as shown on the graph.
(b) When the krill are in 40C water, there is no mRNA I. When the krill are placed in 100C tanks, the concentration of mRNA I increase from θ to 5 ng/mL. When the krill are placed back in 40C tanks for a 6 hour recovery, mRNA I concentration increase for the first 4 hours from 5 to 25 ng/ml, then decreases for the final 2 hours from 25 to 17 ng/ml.
(c) The graph shows that the mRNA I concentration increases most drastically after the krill are moved back to 40C . This suggests that after krill proteins are denatured, then mrNA II has a steep drop-off in concentration after the krill are moved back to 40C , indicating that it is not involved in refolding denatured proteins.
(d) A cell can produce two different mRNAs from the same gene through a process called alternative rNA splicing. Genes contain coding regions called exons that alternative with noncoding regions called introns. When transcription occurs, the pre-MrNA transcript has both exons and introns. The transcript then has its introns removed by a spliceosome and the exons are joined mRNAs can be produced depending on which regions are treated as exons and which are treated as introns.