The diagram shows the mass spectrum of a sample of chlorine. Peaks V, W, X, Y and Z are labelled.
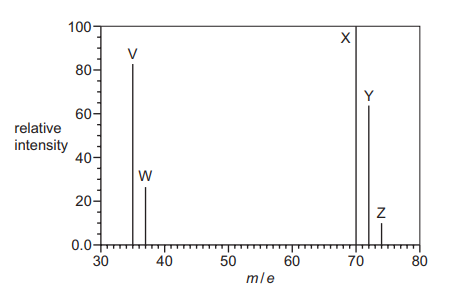
Which statements about this spectrum are correct?
1 The relative atomic mass of chlorine can be calculated from the abundances and m/e values of 2 of the 5 peaks.
2 37.0 g of the species responsible for peak Z contains \(3.011 \times 10^{23}\) molecules.
3 The relative molecular mass of chlorine can be calculated from the abundances and m/e values of peaks X, Y and Z.
A. 1, 2 and 3
B. 1 and 2 only
C. 1 and 3 only
D. 2 and 3 only
▶️ Answer/Explanation
Ans: A
Statement 1: Correct. The relative atomic mass of chlorine is calculated using peaks X (35Cl+) and Y (37Cl+), which represent the two chlorine isotopes.
Statement 2: Correct. Peak Z represents 37Cl2 (m/z = 74). 37.0 g is 0.5 moles, containing \(0.5 \times 6.022 \times 10^{23} = 3.011 \times 10^{23}\) molecules.
Statement 3: Correct. The relative molecular mass of Cl2 is calculated using peaks X (35Cl2+), Y (35Cl37Cl+), and Z (37Cl2+), which correspond to the three possible Cl2 isotopologues.
All three statements are correct, making option A the right choice.
Vitamin C has the structure shown.

The mass spectrum of vitamin C has a molecular ion peak with an m/e value of 176 and a relative abundance of 7.0%. What is the abundance of the M+1 peak?
▶️ Answer/Explanation
Ans: A
The M+1 peak arises due to the natural abundance of 13C isotopes. For vitamin C (\(C_6H_8O_6\)), the probability of one 13C atom is calculated as \(6 \times 1.1\% = 6.6\%\) of the molecular ion peak’s abundance. Given the molecular ion peak has an abundance of 7.0%, the M+1 peak abundance is \(7.0\% \times 6.6\% = 0.462\%\). Thus, the correct answer is A.
A sample of but-2-enoic acid, CH₃CH=CHCOOH, is analysed using infrared spectroscopy. The infrared spectrum shows a broad peak in the range 2500–3000 cm⁻¹.

▶️ Answer/Explanation
Ans: D
1. **Interpretation of the IR Spectrum**: The broad peak at **2500–3000 cm⁻¹** is characteristic of the **O-H stretching vibration** in carboxylic acids, which appears broad due to hydrogen bonding. 2. **Functional Groups in But-2-enoic Acid**: The molecule contains: – A **carboxylic acid (–COOH)** group (confirmed by the broad O-H peak). – An **alkene (C=C)** group (expected absorption at ~1600–1680 cm⁻¹). – A **C=O** stretch (sharp peak at ~1700 cm⁻¹). 3. **Conclusion**: The spectrum matches the structure of but-2-enoic acid, where the broad O-H peak is the most distinctive feature of the carboxylic acid functional group.
The infrared spectrum of a compound is shown.
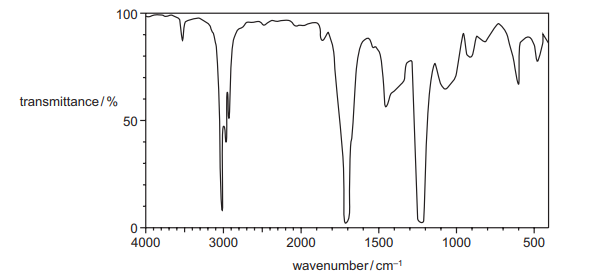
Which functional group could the compound contain?
▶️ Answer/Explanation
Ans: C
The IR spectrum shows:
- A strong absorption at ~1700 cm-1 (C=O stretch, carbonyl group).
- No broad absorption at 2500-3300 cm-1 (O-H stretch of carboxylic acid or alcohol).
- Additional peaks at ~1200-1300 cm-1 (C-O stretch, typical of esters).
These features match an ester (C=O and C-O stretches without O-H). Alcohols (A) and carboxylic acids (B) would show O-H stretches, while nitriles (D) show a sharp peak at ~2200 cm-1 (C≡N), which is absent here.