When some solid Ca₅(PO₄)₃OH is added to a beaker of water, an equilibrium is set up

Which compound, when added to the equilibrium mixture, increases the amount of Ca₅(PO₄)₃OH(s) present?
▶️ Answer/Explanation
Ans: A
The equilibrium involves \(Ca_5(PO_4)_3OH(s) \rightleftharpoons 5Ca^{2+}(aq) + 3PO_4^{3-}(aq) + OH^-(aq)\). Adding \(NH_3\) (a weak base) increases the \(OH^-\) concentration, shifting the equilibrium left (Le Chatelier’s Principle) to reduce \(OH^-\). This favors the formation of more solid \(Ca_5(PO_4)_3OH\).
Other options:
- B (\(NH_4Cl\)): Releases \(H^+\), consuming \(OH^-\) and shifting equilibrium right.
- C (\(CH_3CO_2H\)): An acid, similarly consumes \(OH^-\) and shifts right.
- D (NaCl): No effect on the equilibrium (spectator ions).
In acidic conditions, iodine reacts with propanone in a substitution reaction.
CH₃COCH₃(aq) + I₂(aq) → CH₃COCH₂I(aq) + HI(aq)
The kinetics of the reaction are investigated using a colorimeter. As the I₂ reacts, the yellow/brown colour of the I₂(aq) fades to colourless, changing the absorbance of the solution. Known concentrations of I₂(aq) are used to prepare a calibration curve graph and the absorbance is then measured as the reaction proceeds.

What is the rate of reaction at 20 s?
▶️ Answer/Explanation
Ans: A
The rate of reaction is determined by the slope of the concentration-time graph at \( t = 20 \, \text{s} \). From the graph, the concentration of I₂ decreases linearly, and the slope (rate) is calculated as:
\[ \text{Rate} = -\frac{\Delta [\text{I}_2]}{\Delta t} = \frac{(0.00010 – 0.00020) \, \text{mol dm}^{-3}}{(30 – 10) \, \text{s}} = 5 \times 10^{-6} \, \text{mol dm}^{-3} \, \text{s}^{-1} \]
Since the rate is the magnitude of the slope, the correct answer is A.
The volume of ammonia produced against time is measured in two experiments.
\(N_2(g) + 3H_2(g) → 2NH_3(g) \)∆H = –92 \(kJ mol^{–1}\)
In experiment 1, 3 mol of H2(g) and 1 mol of N2(g) react together at 45°C and a pressure of 200 atm. A graph showing the volume of ammonia produced against time is plotted. Experiment 2 is then performed. Experiment 2 differs from experiment 1 in one condition only.

How does experiment 2 differ from experiment 1?
▶️ Answer/Explanation
Ans: D
The graph shows that experiment 2 produces ammonia at a faster initial rate but reaches a lower equilibrium volume compared to experiment 1. This behavior is characteristic of an increase in temperature for an exothermic reaction (∆H = –92 kJ/mol). Higher temperature speeds up the reaction (faster rate) but shifts equilibrium left (less NH₃), matching option D. Other options (A, B, C) would not explain both observations.
Graphs can be drawn to show the percentage of ammonia at equilibrium when nitrogen and hydrogen are mixed at different temperatures and pressures. Which diagram correctly represents these two graphs?
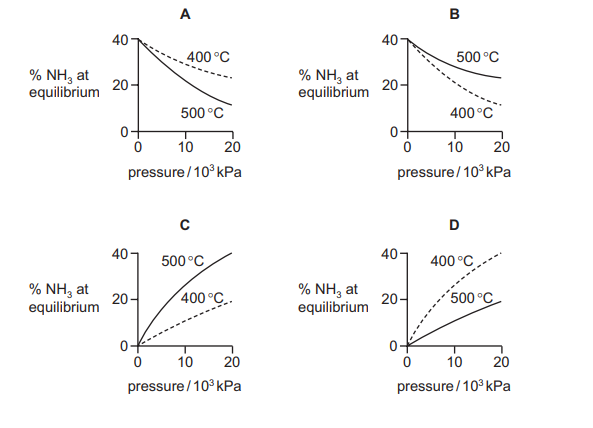
▶️ Answer/Explanation
Ans: D
The Haber process (\(N_2 + 3H_2 \rightleftharpoons 2NH_3\)) is exothermic. According to Le Chatelier’s principle:
- Effect of Temperature: Lower temperatures favor the forward reaction (more \(NH_3\) at equilibrium), so the graph should show higher % \(NH_3\) at lower \(T\).
- Effect of Pressure: Higher pressures favor the forward reaction (fewer gas molecules), so the graph should show higher % \(NH_3\) at higher \(P\).
Graph D correctly represents these trends, making it the correct choice.