Elements X and Y are in Period 3 of the Periodic Table. Element X is either phosphorus or sulfur. Element Y is either sodium or magnesium. Element X forms an oxide that reacts with water to give a solution containing the aqueous anion \(XO_4^{2–}\). One mole of element Y reacts with one mole of chlorine molecules. At the end of the reaction, all of the element Y and all of the chlorine molecules have been used up. What are elements X and Y?

▶️ Answer/Explanation
Ans: D
1. Identifying Element X: The oxide of X forms \(XO_4^{2–}\) in water. Sulfur forms \(SO_4^{2–}\) (sulfate ion), while phosphorus forms \(PO_4^{3–}\) (phosphate ion). Since the given ion has a \(2-\) charge, X must be sulfur (S).
2. Identifying Element Y: Y reacts with chlorine in a 1:1 molar ratio. Sodium (Na) reacts as \(2Na + Cl_2 \rightarrow 2NaCl\) (1:0.5 ratio), while magnesium (Mg) reacts as \(Mg + Cl_2 \rightarrow MgCl_2\) (1:1 ratio). Thus, Y must be magnesium (Mg).
3. Conclusion: The correct combination is X = sulfur (S) and Y = magnesium (Mg), which corresponds to option D in the given table.
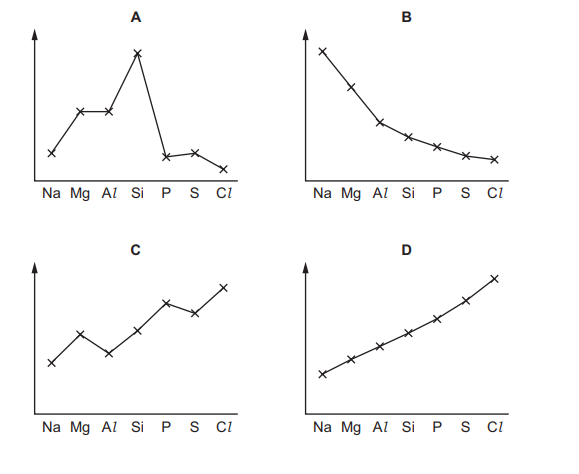
The graphs show trends in four physical properties of elements in Period 3, excluding argon. Which graph has electronegativity on the y-axis?
▶️ Answer/Explanation
Ans: D
Electronegativity increases across Period 3 (from Na to Cl) because the effective nuclear charge increases, attracting bonding electrons more strongly. Graph D correctly shows this trend, where electronegativity rises steadily from left to right, peaking at chlorine (Cl). The other graphs depict different periodic trends, such as atomic radius or melting point.
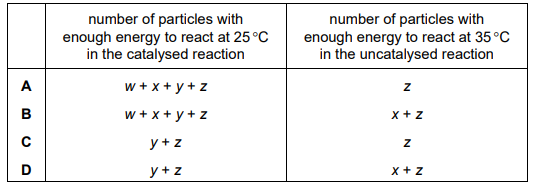
The Boltzmann distribution for a mixture of gases capable of reaction is shown. The two curves represent the mixture of gases at 25°C and at 35°C. The activation energies for the catalysed and uncatalysed reactions are shown.

Which row is correct?
▶️ Answer/Explanation
Ans: D
At higher temperatures (35°C), the Boltzmann curve shifts right, increasing the fraction of molecules with energy ≥ activation energy (\(E_a\)). The catalysed reaction has a lower \(E_a\), so more molecules can overcome it compared to the uncatalysed reaction. The correct row (D) states that the fraction of molecules with sufficient energy increases for both reactions, but the increase is greater for the uncatalysed reaction due to its higher \(E_a\).
The graphs show trends in four physical properties of elements in Period 3, excluding argon. Which graph has electronegativity on the y-axis?
▶️ Answer/Explanation
Ans: D
Electronegativity increases across Period 3 (Na to Cl) because the effective nuclear charge increases, attracting electrons more strongly. Graph D shows this upward trend, matching the expected electronegativity pattern. The other graphs depict different properties (e.g., atomic radius, melting point), making D the correct choice.