Solving Inequalities
A linear inequality is similar to a linear equation, but instead of an equals sign, it uses an inequality symbol:
- \( < \) less than
- \( > \) greater than
- \( \le \) less than or equal to
- \( \ge \) greater than or equal to
Instead of a single solution, an inequality usually has a range of values that make the statement true.
Key Idea
You solve inequalities using the same steps as equations:
- Simplify both sides
- Move variable terms to one side
- Isolate the variable
(The special rule about flipping the sign will be discussed in the next section.)
Important SAT Interpretation
The DIGITAL SAT often asks which values are possible, minimum values, or restrictions from real-life contexts such as budgets, heights, or limits.
Example 1 (Basic Inequality):
Solve:
\( 3x + 5 < 20 \)
▶️ Answer/Explanation
\( 3x < 15 \)
\( x < 5 \)
Conclusion: All values less than 5 satisfy the inequality.
Example 2 (Variables on Both Sides):
Solve:
\( 5x – 2 \ge 3x + 8 \)
▶️ Answer/Explanation
\( 2x – 2 \ge 8 \)
\( 2x \ge 10 \)
\( x \ge 5 \)
Conclusion: \( x \ge 5 \).
Example 3 (Word Context):
A concert ticket costs \$12 and you have at most \$90 to spend. What is the maximum number of tickets you can buy?
▶️ Answer/Explanation
Let \( x \) be tickets.
\( 12x \le 90 \)
\( x \le 7.5 \)
Tickets must be whole numbers.
Conclusion: Maximum is 7 tickets.
Graph on a Number Line
After solving a linear inequality, the solution is a set of values. Instead of a single point, we represent the solution on a number line.
Key Graphing Rules
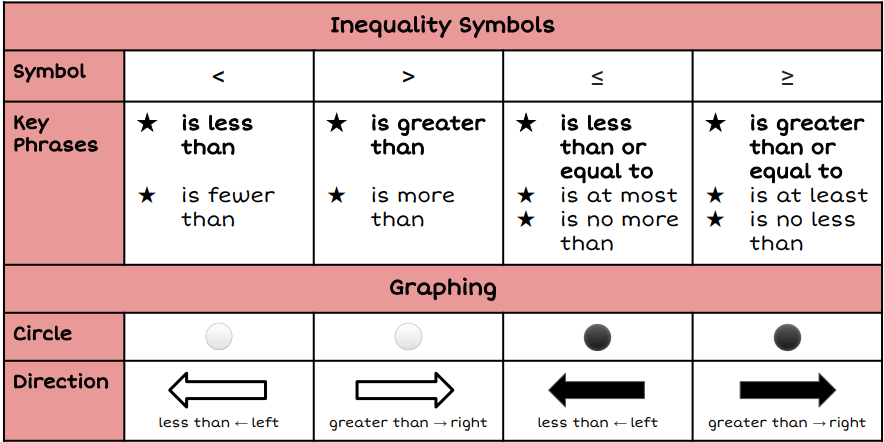
- Open circle → value is NOT included (\( < \) or \( > \))
- Closed circle → value IS included (\( \le \) or \( \ge \))
Direction of Shading
- Shade right → greater than
- Shade left → less than
SAT Tip
Sometimes the test gives a graph and asks which inequality it represents. Carefully check whether the circle is open or closed.
Example 1:
Solve and graph:
\( x > 3 \)
▶️ Answer/Explanation
3 is not included → open circle at 3.
Shade to the right.
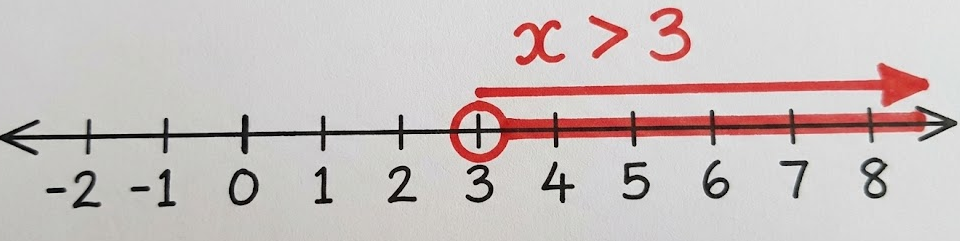
Solution set: all numbers greater than 3.
Example 2:
Solve and graph:
\( x \le -2 \)
▶️ Answer/Explanation
-2 is included → closed circle at -2.
Shade to the left.
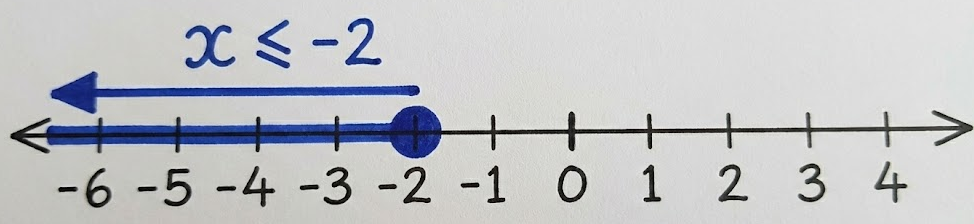
Solution set: all numbers less than or equal to -2.
Example 3:
Solve and graph:
\( 2x – 4 < 6 \)
▶️ Answer/Explanation
\( 2x < 10 \)
\( x < 5 \)
Open circle at 5 and shade left.
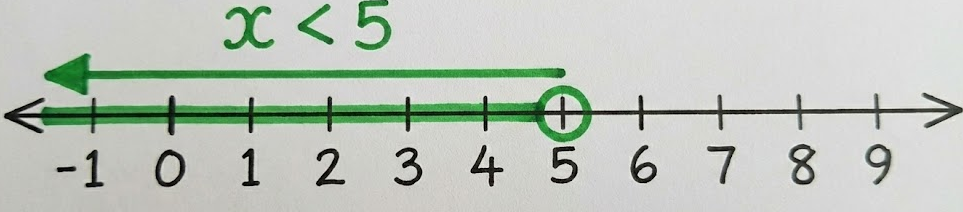
Solution: \( x < 5 \).
Systems of Inequalities
A system of inequalities consists of two or more inequalities that must be true at the same time. The solution is the set of values that satisfy all inequalities simultaneously.
Instead of a single number, the solution is usually a region on a graph.
How to Solve Graphically
- Graph each inequality as a boundary line
- Decide whether the line is dashed or solid
- Shade the correct side
- The overlapping shaded region is the solution
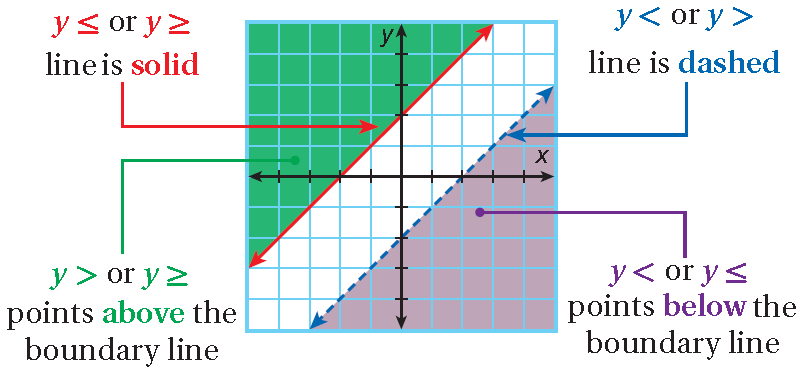
Solid vs Dashed Line
- \( \le \) or \( \ge \) → solid line (included)
- \( < \) or \( > \) → dashed line (not included)
Testing the Correct Side
Use a test point such as \( (0,0) \):
- If the inequality is true → shade that side
- If false → shade the other side
DIGITAL SAT Meaning
These often represent constraints such as budget limits, minimum requirements, or maximum capacity.
Example 1:
Which region satisfies the system?
\( y \ge x – 1 \)
\( y < 3 \)
▶️ Answer/Explanation
First boundary: \( y = x – 1 \) → solid line and shade above.
Second boundary: \( y = 3 \) → dashed horizontal line and shade below.
The solution is the overlapping shaded region between the two lines.
Example :
Does the point \( (2,1) \) satisfy the system?
\( y \ge 2x – 3 \)
\( y \le 4 \)
▶️ Answer/Explanation
Check first inequality:
\( 1 \ge 2(2) – 3 \)
\( 1 \ge 1 \) ✓
Check second inequality:
\( 1 \le 4 \) ✓
Conclusion: The point satisfies the system.
Example :
A student must study at least 3 hours but no more than 6 hours per day. Let \( h \) be hours studied.
▶️ Answer/Explanation
\( h \ge 3 \)
\( h \le 6 \)
This represents all values between 3 and 6 inclusive.
Solution: \( 3 \le h \le 6 \).