Linear + Quadratic Systems
A non-linear system is a system of equations where at least one equation is not linear.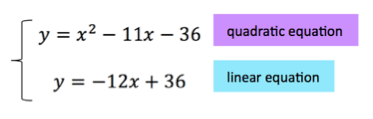
The most common DIGITAL SAT case is:
a line and a parabola
Example form:
\( y=mx+b \)
\( y=ax^2+bx+c \)
Meaning of the Solution
The solution(s) are the point(s) where the graphs intersect.
How to Solve (Substitution Method)
- Set both equations equal (since both equal \( y \))
- You get a quadratic equation
- Solve the quadratic
- Substitute back to find \( y \)
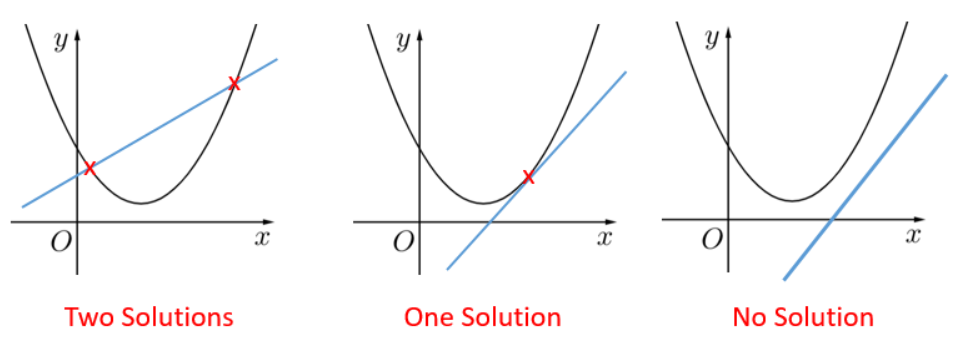
Possible Outcomes
- 2 solutions → line crosses parabola twice
- 1 solution → line touches parabola (tangent)
- 0 solutions → no intersection
DIGITAL SAT Tip
SAT rarely asks you to draw the graph. Instead it asks for the intersection coordinates.
Example 1:
Solve the system:
\( y=x+1 \)
\( y=x^2 \)
▶️ Answer/Explanation
Set equal:
\( x+1=x^2 \)
\( x^2-x-1=0 \)
\( x=\dfrac{1\pm\sqrt{5}}{2} \)
Find y:
\( y=x+1 \)
Solutions: two intersection points
Example 2:
Solve:
\( y=2x+3 \)
\( y=x^2+3 \)
▶️ Answer/Explanation
\( 2x+3=x^2+3 \)
\( x^2-2x=0 \)
\( x(x-2)=0 \)
\( x=0,\;2 \)
\( y=3,\;7 \)
Solutions: \( (0,3) \) and \( (2,7) \)
Example 3:
Solve:
\( y=x+2 \)
\( y=x^2+2x+1 \)
▶️ Answer/Explanation
\( x+2=x^2+2x+1 \)
\( x^2+x-1=0 \)
One repeated intersection indicates tangency.
Conclusion: line touches parabola once.
Graph Interpretation
In a non-linear system, solutions represent the intersection points of the graphs.
Most DIGITAL SAT questions do NOT ask you to solve algebraically. Instead, you must interpret what the graph means.
Typically the system includes:
- a line (linear model)
- a parabola (quadratic model)
Key Interpretation Idea
At an intersection point:
both equations give the same \( x \) and the same \( y \)
So the two real-world quantities are equal at that moment.
Number of Solutions from Graph
- 2 intersections → 2 solutions
- 1 intersection → 1 solution (tangent)
- 0 intersections → no solution
Very Important SAT Meaning
The x-coordinate usually answers the question.
- time
- quantity
- number of items
The y-coordinate is the shared value.
DIGITAL SAT Tip
If the problem says “when are the two quantities equal?”, it is asking for the intersection x-value.
Example 1:
A graph shows the height of a thrown ball (parabola) and the height of a platform (line). What do the intersection points represent?
▶️ Answer/Explanation
They are the times when both heights are equal.
Answer: the moments the ball is at the same height as the platform.
Example 2:
Two functions represent cost and revenue. What does the intersection point mean?
▶️ Answer/Explanation
Cost = revenue.
Answer: the break-even point.
Example 3:
One graph models water filling a tank and another models water leaking. What does the intersection represent?
▶️ Answer/Explanation
Both amounts are equal.
Answer: the time when water added equals water lost.