Mean, Median, Mode
In statistics, we often summarize a data set using measures of center.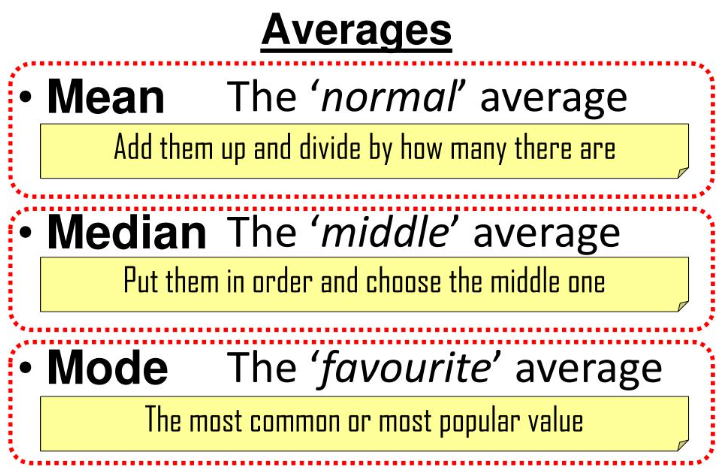
1. Mean (Average)
Add all values and divide by the number of values.
\( \text{Mean}=\dfrac{\text{sum of data}}{\text{number of values}} \)
Important: Mean is affected by very large or very small values.
2. Median
The middle value after arranging the data in order.
- Odd number of values → middle number
- Even number of values → average of two middle numbers
3. Mode
The value that appears most frequently.
- No mode → no repeated values
- Two modes → bimodal
DIGITAL SAT Tip
If an extreme value exists (outlier), SAT usually wants the median, not the mean.
Example 1 (Mean):
Find the mean of: 4, 6, 8, 10, 12.
▶️ Answer/Explanation
Sum \( =40 \)
\( \dfrac{40}{5}=8 \)
Answer: 8
Example 2 (Median):
Find the median of: 3, 5, 7, 9, 11, 13.
▶️ Answer/Explanation
Middle two numbers: 7 and 9
\( \dfrac{7+9}{2}=8 \)
Answer: 8
Example 3 (Mode):
Find the mode of: 2, 4, 4, 5, 6, 6, 6, 8.
▶️ Answer/Explanation
6 appears most often.
Answer: 6
Range & IQR
Measures of spread describe how far the data values are from each other.
1. Range
The difference between the largest and smallest values.
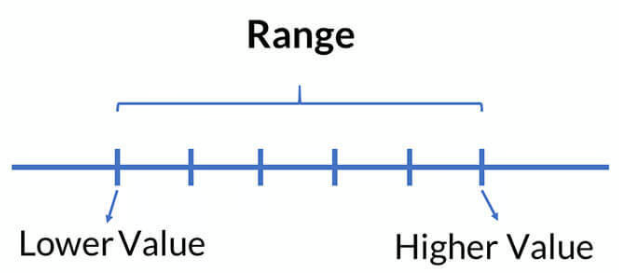
\( \text{Range}=\text{maximum}-\text{minimum} \)
2. Quartiles
Quartiles divide ordered data into four equal parts.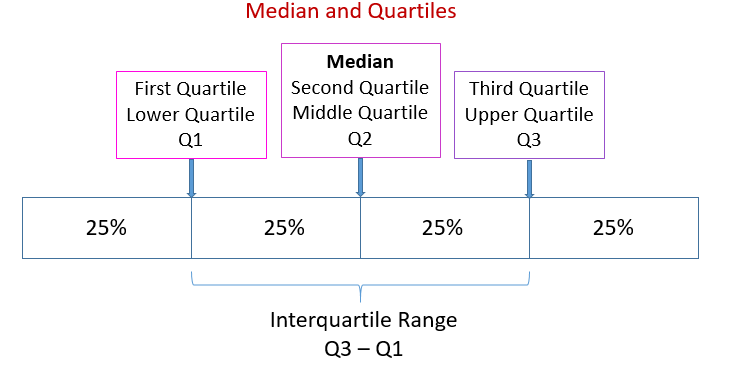
- \( Q_1 \) → lower quartile (25%)
- \( Q_2 \) → median (50%)
- \( Q_3 \) → upper quartile (75%)
3. Interquartile Range (IQR)
The spread of the middle 50% of data.
\( \mathrm{IQR}=Q_3-Q_1 \)
IQR is preferred because it is not affected much by extreme values.
DIGITAL SAT Tip
SAT often gives box plots. Remember: the box length equals the IQR.
Example 1 (Range):
Find the range of: 5, 7, 9, 12, 18.
▶️ Answer/Explanation
\( 18-5=13 \)
Answer: 13
Example 2 (Quartiles & IQR):
Find the IQR of: 2, 4, 6, 8, 10, 12, 14, 16.
▶️ Answer/Explanation
Median \( Q_2=9 \)
Lower half: 2, 4, 6, 8 → \( Q_1=5 \)
Upper half: 10, 12, 14, 16 → \( Q_3=13 \)
\( \mathrm{IQR}=13-5=8 \)
Answer: 8
Example 3 (Interpretation):
The IQR of test scores is 12. What does this mean?
▶️ Answer/Explanation
The middle 50% of scores lie within a 12-point interval.
Answer: central half of the data spans 12 points.
Outliers
An outlier is a data value that is much larger or much smaller than the rest of the data.
Outliers can strongly affect the mean but usually do not affect the median very much.
How to Identify an Outlier (IQR Rule)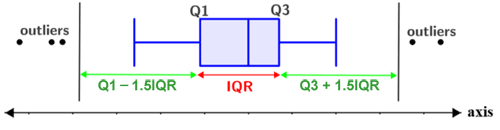
First compute the interquartile range:
\( \mathrm{IQR}=Q_3-Q_1 \)
Then calculate the boundaries:
Lower bound \( =Q_1-1.5(\mathrm{IQR}) \)
Upper bound \( =Q_3+1.5(\mathrm{IQR}) \)
Any value outside this interval is an outlier.
Box Plot Connection
On a box plot, outliers are shown as individual points beyond the whiskers.
DIGITAL SAT Tip
If an outlier appears, the median is usually the better measure of center.
Example 1 (Identify Outlier):
Data: 3, 5, 6, 7, 8, 9, 10, 30
▶️ Answer/Explanation
\( Q_1=5.5 \), \( Q_3=9.5 \)
\( \mathrm{IQR}=4 \)
Upper bound \( =9.5+1.5(4)=15.5 \)
30 exceeds 15.5.
Answer: 30 is an outlier.
Example 2 (Effect on Mean):
Data set: 10, 11, 12, 13, 14, 60 What happens to the mean?
▶️ Answer/Explanation
60 pulls the average upward.
Answer: the mean increases significantly.
Example 3 (Best Measure):
A data set contains extreme values. Should you use mean or median?
▶️ Answer/Explanation
Median is resistant to outliers.
Answer: median